
Hear me out. We all know that China lies about their statistics: they lie that their GDP is growing faster than it is, they lie that their population is larger than it is, they lie that the real estate market (their retirement savings) is doing better than it is. We all know it. We all say it. But what if they’re telling the truth? Would we have been making bad business decisions and national policy? You should answer that question to yourself before you read further.
Bottom Line Up Front
I set out to validate what I “knew” about Chinese policy. Trust but verify. So I used ancillary data sources to create independent buildups of Chinese statistics. Even if China lies, they’re not going to be able to cook the books of all of their trading partners, the satellites, and the many minor bureaucracies.
I’ll come right out and say it: China does not fabricate its topline national statistics. I was wrong. I apologize for contributing to the echo chamber.
The cumulative overstatement of reported GDP growth from 2000 to 2019 is 0.07% measured against satellite nighttime lights and electricity consumption. If you want truth in statistics, the band is -0.5% to 0.6%. Over two decades. That’s not a lie.
The population count is accurate too. The viral claim that China overcounts its population by 130 million dies against the hardest independent count available: first-grade school enrollment. The school rolls land within about a million of the official birth series, and they run slightly high. Chinese local police register births and they published those numbers from 2019 before the publications were abruptly stopped after 2021. Those babies started in first grade in 2025. I made a testable hypothesis that the 2025 school enrollment numbers would match the 2019 birth numbers. If China is cooking their population statistics then they would have needed a grand conspiracy to cook the birth records of every local police station so they lined up with the school enrollment statistics five years later. China published their 2025 school enrollment numbers on July 6, 2026 and the 2025 first-grade class matches the 2019 births to within a percent. I predict the next two years of school registration records will match past birth reporting as well.
What Beijing manages is embarrassment. When a published statistical series turns embarrassing the series dies. Urban youth unemployment was suspended the month after it printed 21.3%. The national count of cremated remains stopped printing in the year my analysis puts about 1.35 million uncounted excess deaths against an official toll of 83,000. They lied, and then they just stopped saying anything. But their funeral homes trade association kept printing the number of cremation furnaces in the country so we can interpolate the death rate China stopped reporting.
The statistics on capital flight through underground banks (地下钱庄) published its last full-year national figure for 2016. And the 80+ million-judgment public court archive Beijing itself had built was gutted: the political charges scrubbed to zero in one quarter, at least 11 million records pulled, and the flow of new judgments finally diverted into a courts-only internal database.
Embarassing numbers are either hidden, or printed once and then hidden, or cooked once and then hidden. That sounds more like the challenge of managing a sprawling bureaucracy cleaning up embarrassments as soon as they notice, not a top-down grand conspiracy to cook the books.
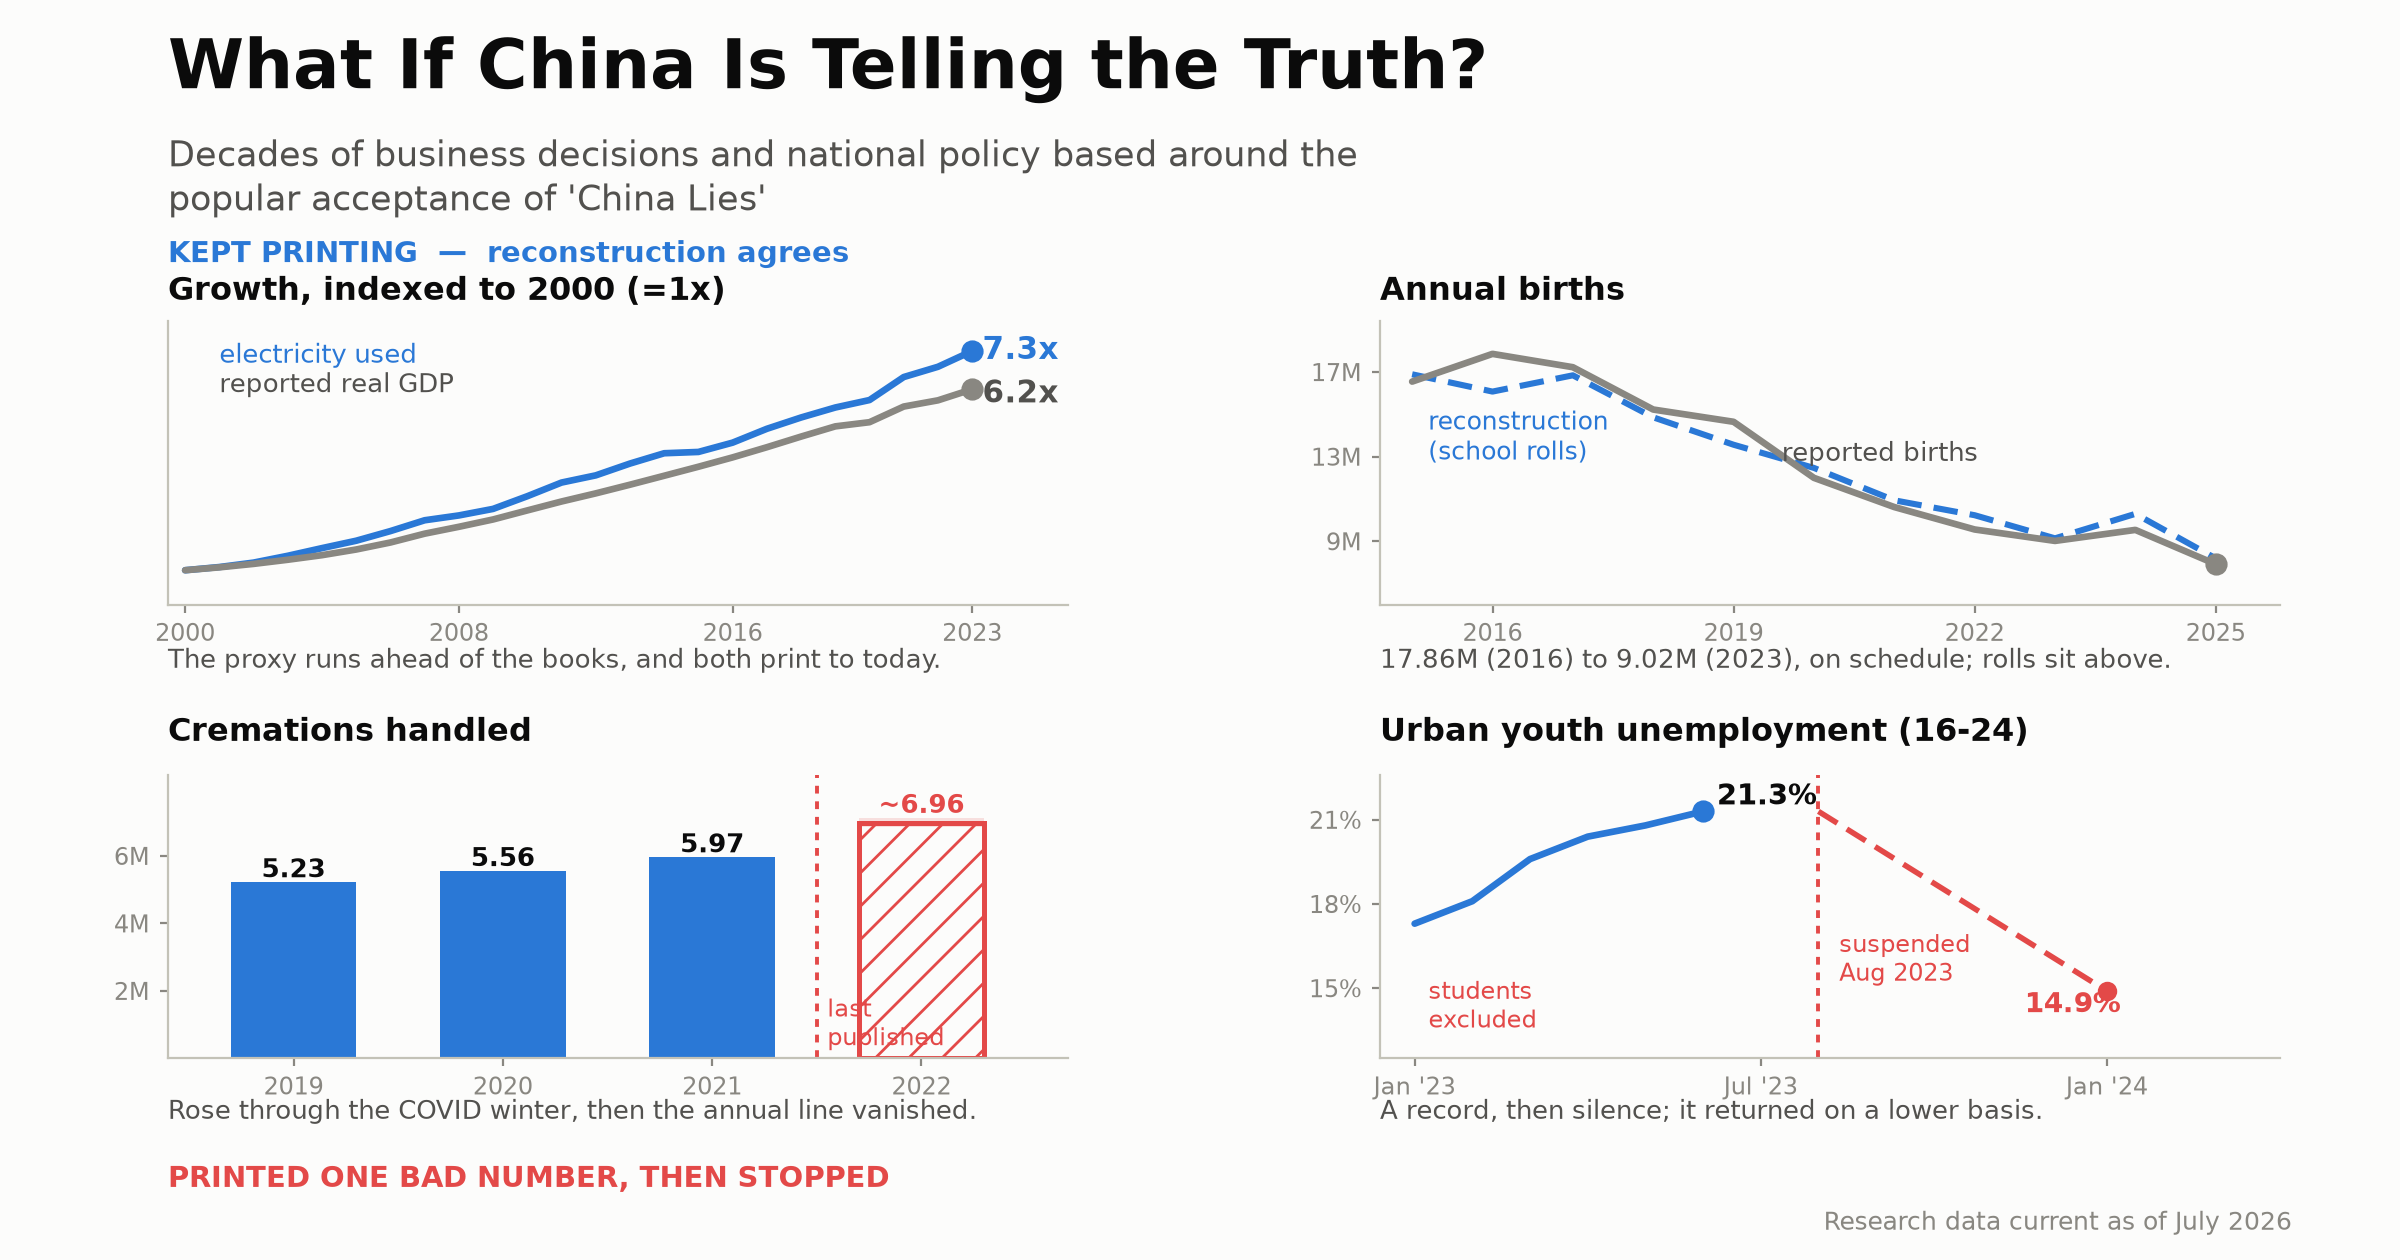
What to see: the last value each vanished series printed, and the date the printing stopped; each series shown here stopped while its number was getting worse.
The research data was current as of July 2026. One currency note: where yuan convert, I use a round 7 yuan to the dollar.
Where the assumption came from
I inherited the assumption that “China lies”, so let’s dig into the etymology behind that community consensus. In December 2010 WikiLeaks published a 2007 cable in which Li Keqiang, then a provincial party secretary, told the US ambassador that GDP figures were “man-made” and that he watched electricity, rail freight, and loan volume instead. The cable was about Liaoning, one rust-belt Chinese province. The wire coverage dropped that provincial qualifier within days. The Economist coined the “Li Keqiang index” the same week, and a remark about one province became a standing indictment of the Chinese economy and their national character. The confessions that followed seemed to settle it: Liaoning admitted padding its numbers in 2017, Inner Mongolia and Tianjin in 2018.
Now let’s look at the echo chamber. I coded eight years of Western press coverage of Chinese statistics, 966 titles. About 6% endorse the fraud narrative outright, 93% are neutral, and the number of rebuttals written by Westerners is zero. The only pushback in the entire pile came from Chinese state media and one aggregator relaying it. Even the Federal Reserve’s staff, who rebutted the fake-data reading inside both the 2015 and 2016 China-panic meetings of the FOMC (the Fed’s rate-setting committee), could not quiet the echo chamber.
So I checked, with three research projects and the general approach of never trusting a Chinese number I could not measure a second way: from orbit, from the electricity meter, from school enrollment tables, from foreign customs mirrors, and from almost a terabyte of court records Beijing published and later thought better of.
Spherical Sacred cow one: China fakes their GDP
Run the Li Keqiang method for real at China-scale and it exonerates the GDP statistics. Electricity consumption grew 7.34x from 2000 to 2023. Reported GDP grew 6.23x. Looking at the satellite imagery (from the birds whose sensors don’t saturate), from 2013 to 2023 the Chinese light emissions grew 1.99x against reported GDP’s 1.79x. The laws of physics do not participate in conspiracies.
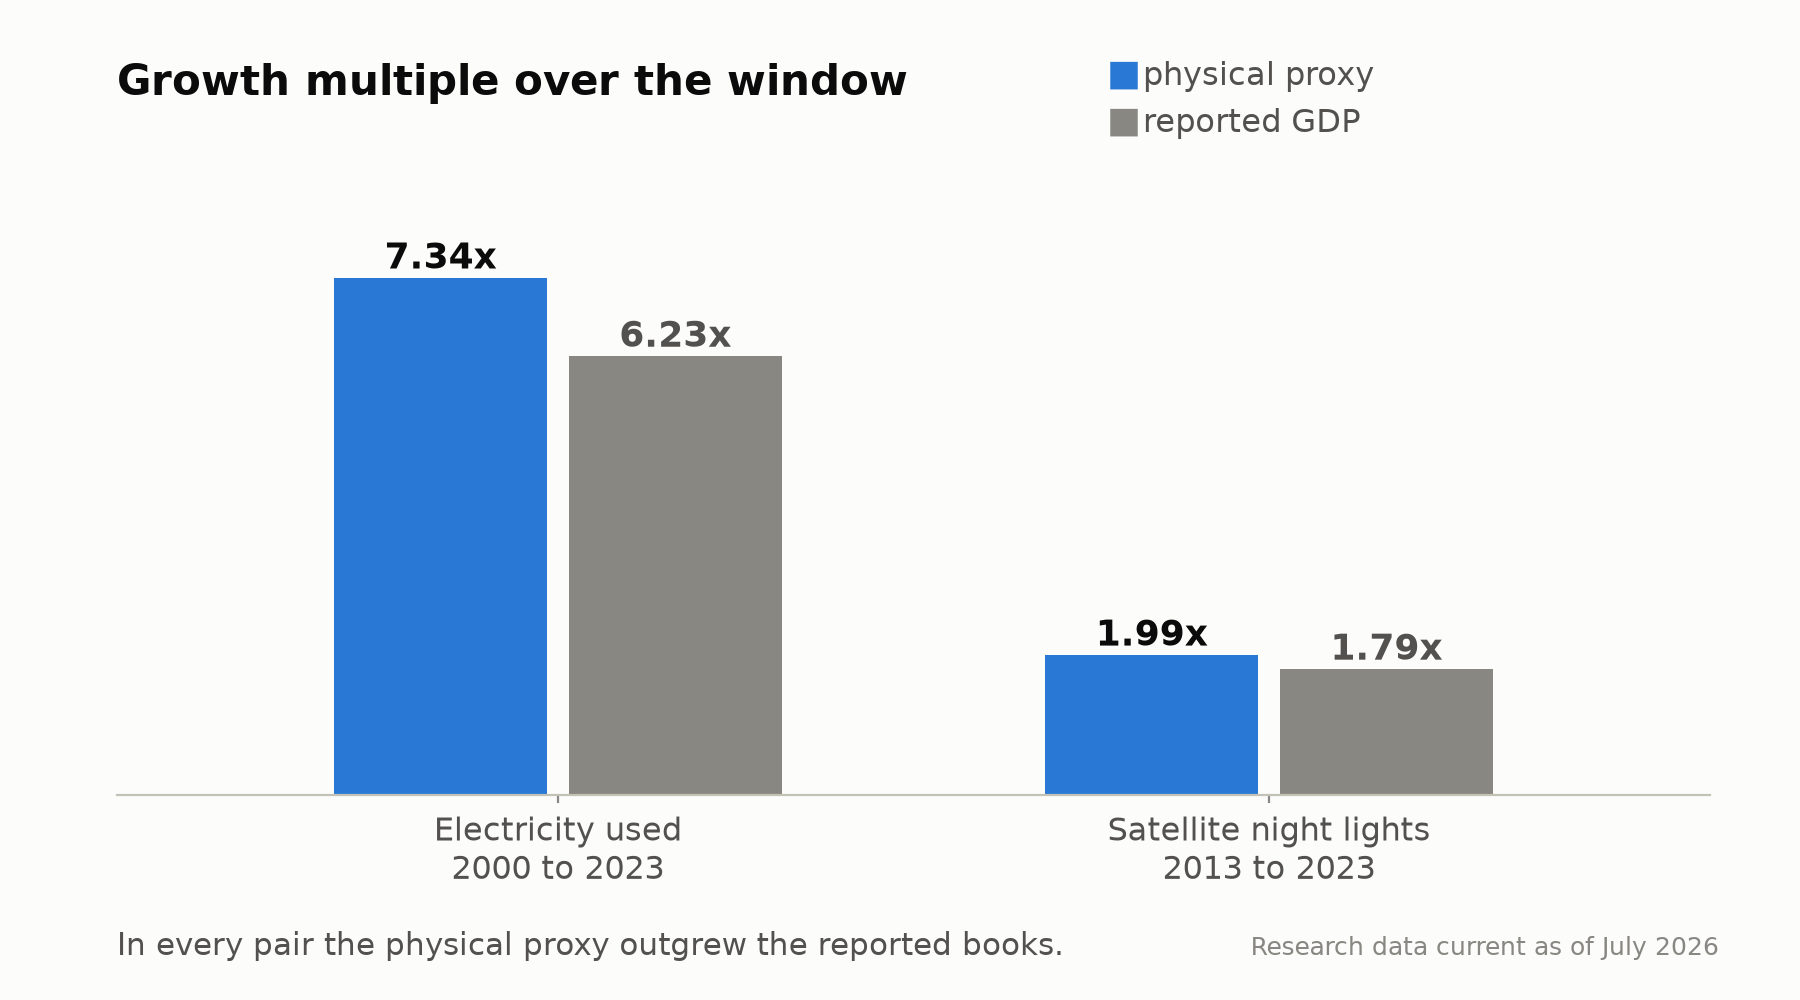
What to see: each pair is an independent physical proxy next to reported GDP over the same window; the proxy bar is taller in every pair, meaning the physical economy outran the books.
The satellite work uses a harmonized nighttime-lights record, about 2.5 billion pixels a year across 237 countries and territories, so China is judged on the same calibration curve as everyone else. Autocracies as a class really do pad their growth statistics. But compare China’s light growth against the economic growth it reports and the padding estimate is about zero. And the most influential academic finding of large Chinese overstatement turns out to be substantially a sensor artifact: the older satellite fleet sensors saturate over bright cities, which hid 40% of China’s light growth. You can think of a physical sensor as an analog to digital converter. If it is an 8-bit sensor then the largest light reading is 255. If there are 256, 300, or 3000 units of light then the sensor still reads 255. That’s sensor saturation (and this might be the first time I used my electrical and computer engineering bachelor’s degree this year). Run the analysis on the saturating sensor and it reads like they overstate their GDP by 86%. Correct the saturation and it falls to 12%. The sensor lied, not the Chinese government.
If a satellite doesn’t convince you then German and Japanese customs officers might. Run the mirror-image test: take what China claims it exported and check it against what its trading partners’ own customs bureaus counted coming off the ships. I pulled the IMF’s bilateral trade mirrors, both directions, 2000 through 2025. Two boring and one interesting accounting artifacts need to be stated first: imports are counted at the arrival price and exports at the dock price; freight and insurance add about 6%; and shipments routed through Hong Kong get attributed to China by the final importer. Math those out and for the two decades through 2019, China’s reported exports to the US, Japan, and Germany reconcile with what those three countries recorded receiving. If anything the Chinese figures run a bit low. China is not lying about its export economics. Caveat lector: The US/China mirror does crack in 2020 with China reporting more than Washington counts. I assume, but have not verified, that the split was evading tariffs by cross-shipping through other countries.
The trade mirror did catch one big Chinese lie but it wasn’t the government’s lie. In 2013 China reported $148 billion more in exports to Hong Kong than Hong Kong reported receiving. That’s a 62% overstatement. Those were phantom invoices smuggling hot money into the country disguised as export earnings, evading the capital controls worth about 1% of GDP at its peak. China’s foreign-exchange regulator issued a circular in May 2013 aimed squarely at over-invoiced exports to Hong Kong, and by 2016 the overstatement had collapsed to 24%. This lie is about capital flight, not inflating GDP or export numbers.
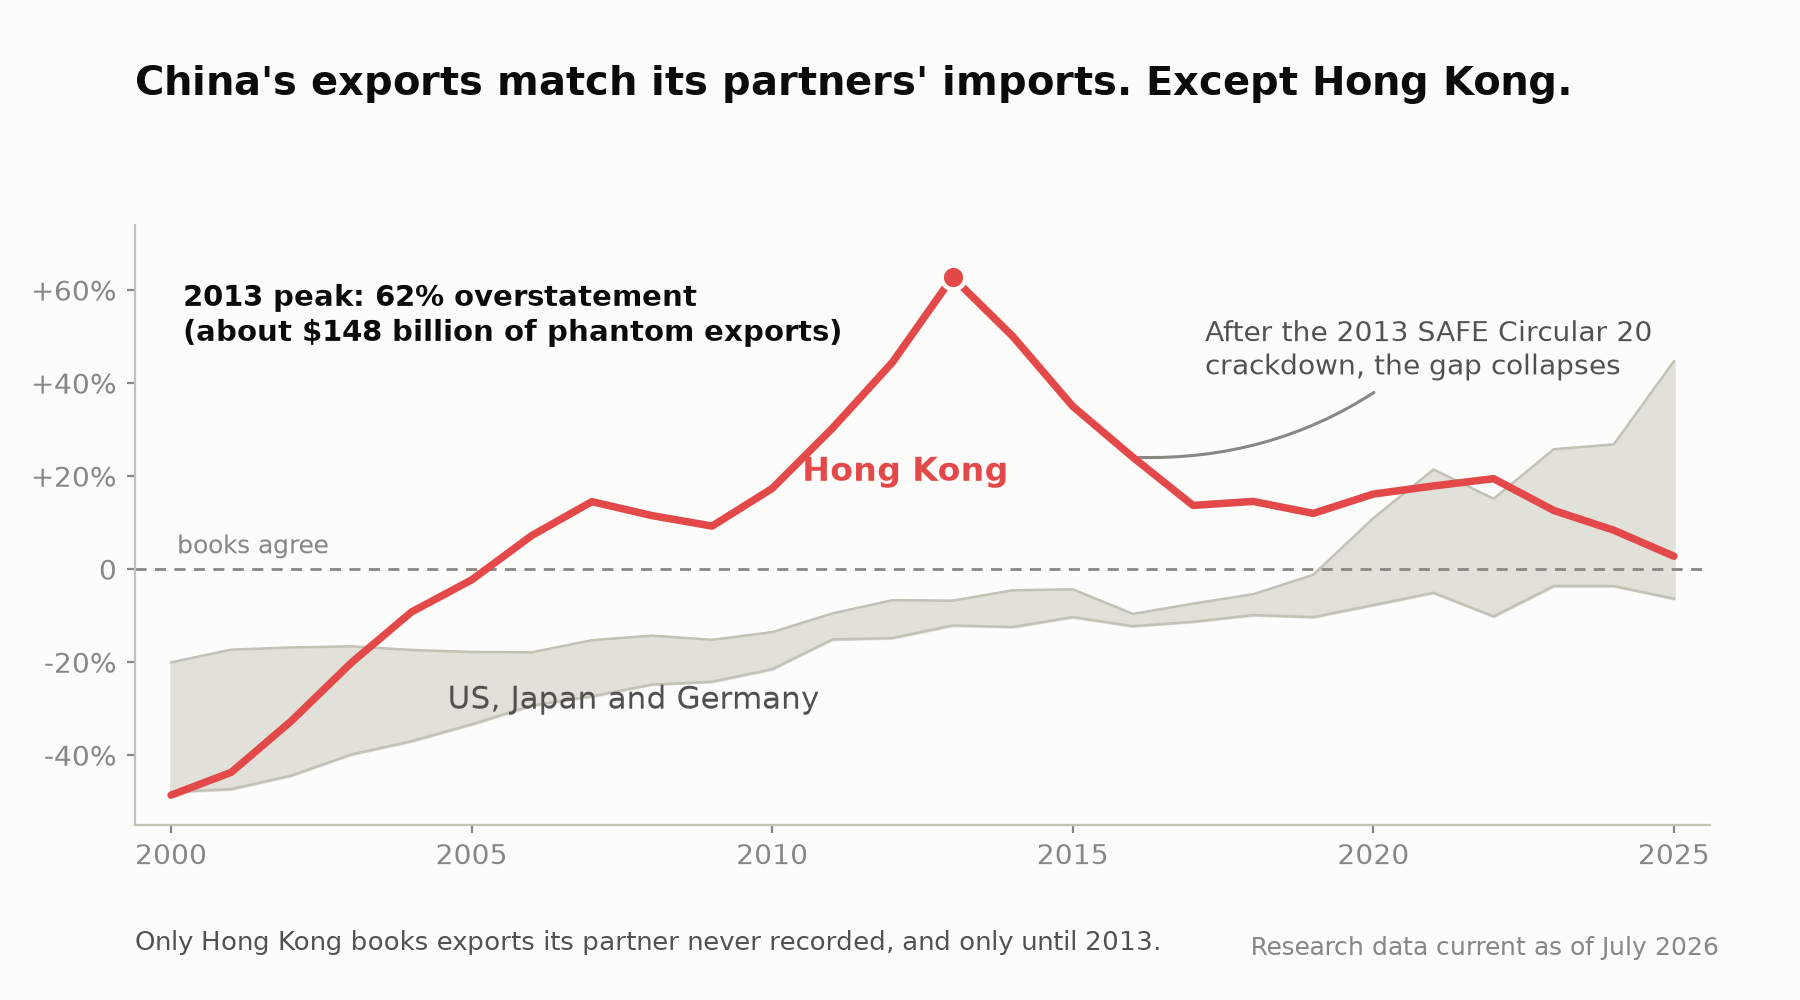
What to see: Hong Kong’s export gap (red) jumps to an impossible +63% in 2013, then collapses after Beijing’s crackdown; the US, Japan, and Germany band never breaks positive, which is what ordinary accounting looks like, not fabrication.
How Beijing actually manages its GDP data is shaving the peaks of good years to fill the holes of embarrassing bad years. The official growth series is about twice as smooth as the electricity underneath it: the year-to-year volatility of reported growth is about half that of the electricity, a volatility ratio of 1.98x (truth in statistics: the band 1.5x to 3.3x). In 2015, reported growth was 7.0% while electricity consumption grew 0.9%; there was a real downturn that year and the GDP data smoothed it away. The books also pass the boring forensic accounting: 1,023 province-year GDP figures conform to Benford’s digit distribution, and when I audited 596 figures across 98 statistical filings for unit errors, I found exactly one, a mistyped multiplier. I probably made more typos in this writeup than China did in their published data.
So the honest assessment is narrower than either the China hawks or Sinophiles might want: China’s published long-run growth trend is real to within a rounding error. The current growth rate might be smoothed today and sit a few percent high (my estimate is around 4% with the truth-in-statistics range 0% to 10%, but I would not bet on it), and the year-to-year path is smoothed to fill the embarrassing years by clipping the good years.
Spherical Sacred cow two: the population is padded
The popular western claim says China’s real population is 1.28 billion, not 1.41 billion, an overcount of 130 million. It went viral because it is checkable in principle. I repeated it without checking it. Let’s check it.
Children are the population cohort you can validate, because a baby who exists shows up at school a few years later. The state allocates real budget, and builds or shutters schools based on those numbers. I took first-grade entrants from the Ministry of Education, adjusted for mortality, and compared them with the official birth counts for the 1994 to 2010 birth cohorts. The schools enrolled 3.1% more children than the birth statistics said existed. Not fewer. More, which is what you would expect if unplanned births were hidden from the registrar and surfaced at school enrollment age. The 2020 census age structure agrees with both series within 1% to 7% for ages 5 through 14. And the UN’s own demographers put China’s population 15 million above the official census. The independent checks disagree with Beijing in both directions by a million-scale margin, which is what honest measurement error looks like. A 130-million-person hole is not there to find.
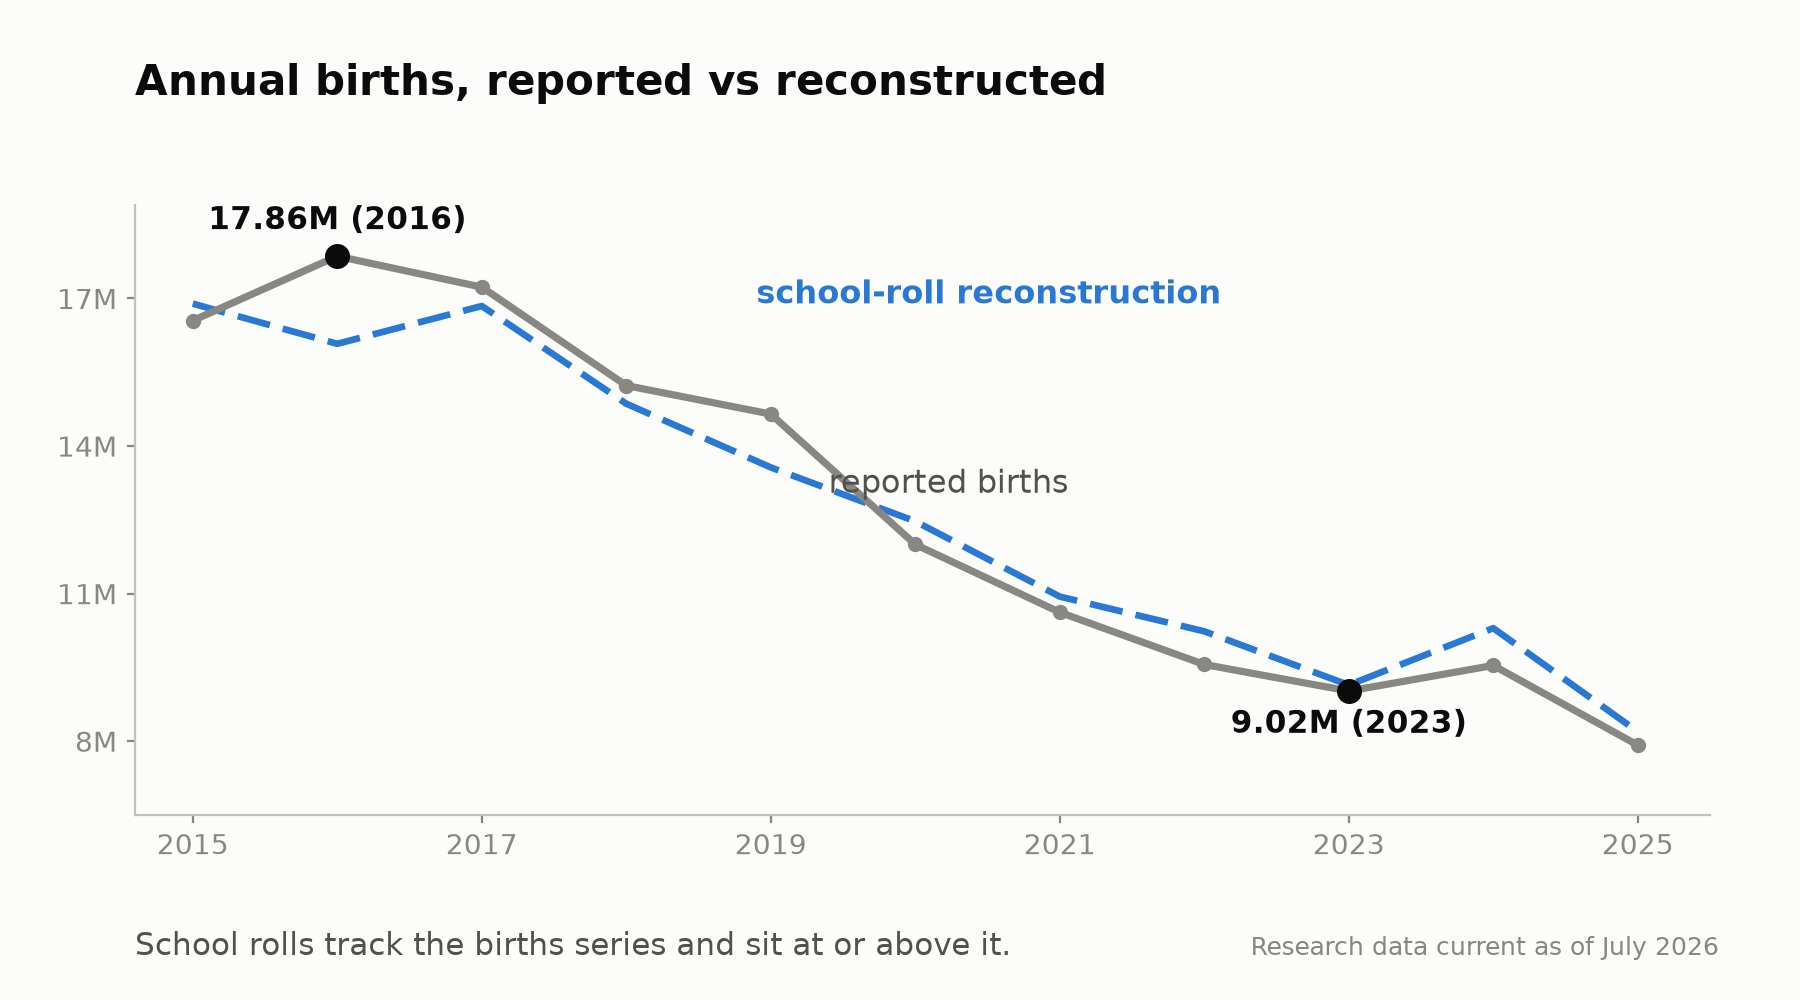
What to see: survival-adjusted first-grade enrollment tracks the official birth series cohort by cohort, sitting slightly above it; an overcount would put enrollment far below the line.
That check was a prediction when I started this research, and it resolved while I procrastinated writing this up. Here is the setup. Local police stations register every newborn into the household system, and the Ministry of Public Security used to publish the annual counts: 11.79 million newborn registrations in 2019, 10.04 million in 2020, 8.87 million in 2021, then nothing, which by now you will recognize as the pattern. Police registration is a lower limit that runs about 80% to 84% of the official birth figure, because out-of-plan babies register late or never. So for the children born around 2019, three bureaucracies that cannot coordinate a lie (and the national bureaucracies distrust every number the locals produce anyway) each produced a number: a police number of 11.79 million birth registrations, the statistics bureau’s count of 14.65 million births where they correct for their distrust of the provincial numbers, and the Ministry of Education’s tally of the same cohort walking into first grade in the autumn of 2025. The first two were locked into the public record years before the third existed.
In July 2026 the education ministry published its number of 14.62 million first graders, against the 14.65 million births published in 2019. It sits well above the police’s birth count, which is exactly where the late registrations should surface. And the intake fell about 9.6% from 2024’s, tracking the real birth decline from 2018 into 2019. For China to be faking its population statistics today, its local police stations and national statistics bureau would have had to fake their birth registrations years ago, in a way that happened to line up with a school enrollment count the education ministry only published in 2026. And we can compare the police undercount rate of out-of-plan babies for the next two years. That is not cooking the books. That is time travel.
The real demographic story needed no fabrication to be terrifying, and Beijing published it on schedule, every year: births fell from 17.86 million in 2016 to 9.02 million in 2023. Cut in half in seven years. Fertility is at about one child per woman. They’ve already gone off the demographic decline cliff. And they’re publicly narrating the fall on their way down.
The tell: the errors only run one way
Here is the pattern that helped me reframe how I think of China. I took the impressive claims that a lying autocratic regime would inflate, and tested six of them against independent data: all six were confirmed or exceeded. The cleanest case is solar power, where independent measurement finds about 1.2 times the officially claimed capacity. China under-reports one of its flagship green and energy-security achievements.
A country that fabricated numbers would fabricate in both directions, burying failures and pumping triumphs. China’s misreporting is one-directional. The good news is real, even understated. The bad news is real too, right up until they stop reporting it.
What actually gets deleted
Because the toplines are honest, the deletions are legible. You can see exactly what goes missing, and it is not what a crude propaganda model predicts. Beijing kept publishing its foreign-exchange reserves through a trillion-dollar drawdown. It publishes the errors-and-omissions residual that betrays capital flight. It published the 2023 population decline and the worst GDP miss in decades. What dies is different: a series dies when it is embarrassing and outside analysts could decompose it into who and how bad.
I have been aggregating, translating, extracting and analyzing public data from a lot of Chinese bureaus for the last few weeks. Part of that was analyzing every official statistic, linking them across natural bureaucratic changes and reorganizations, and identifying when a statistical series stopped being reported. There were 28 of them. Twenty-three of them died between 2021 and 2025. Eighteen were deteriorating at the moment of the cut and only four improving. Of those, there were six natural experiments where a bureaucracy published two related series where one was flattering and one was embarrassing. In all six cases, the bureaucracy killed the embarrassing series while continuing to print the flattering one. For example, the Ministry of Finance killed the communiqué itemizing how land-sale money was spent after the 2015 edition; but they kept printing the land-revenue side. The count of cremated remains vanished during Covid; but the (increasing) count of cremation furnaces did not, presumably because it showed a growing industry. Second, the timing: the embarrassing statistics die in a cluster after 2021. I can’t tell if that’s related to the Covid unrest, Xi’s election to a third term, or something else.
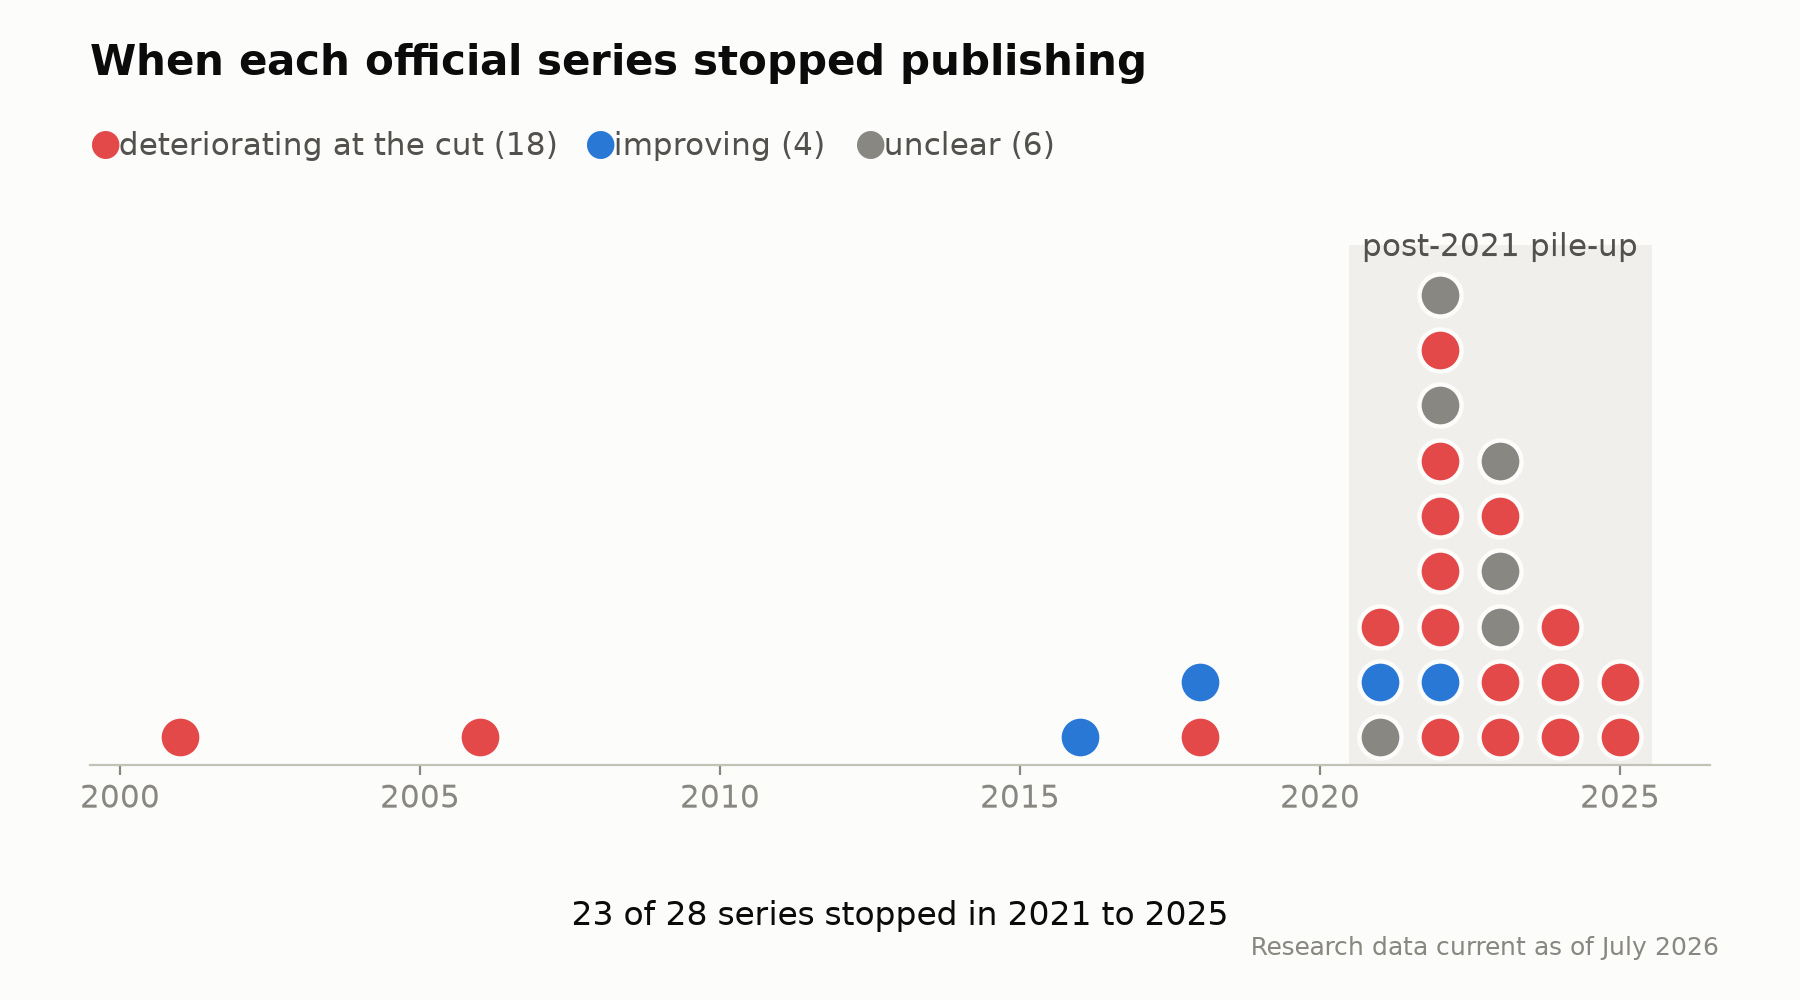
What to see: each marker is an official series at the year its publication stopped; the pile-up after 2021 is the phase change.
Let’s draw the shape of four statistics’ corpses on the floor where they died:
1. The labor number. Urban youth unemployment was reported at a record 21.3% in June 2023. In August the National Bureau of Statistics suspended the series. It returned months later with a new definition that excludes students, which mechanically lowers it. The old series was never resumed.
2. The bodies. The Ministry of Civil Affairs published the national count of cremated remains every year: 5.23 million in 2019, 5.56 million in 2020, 5.97 million in 2021. Then the December 2022 reopening Covid-19 wave hit, and that annual statistic simply stopped being reported. The adjacent mortuary statistics, including furnace counts, kept rising and kept printing. Project the cremations and furnace numbers forward from the three quarters of 2022 that China had already printed, plus one province’s count that was posted and then scrubbed (oops), and you get roughly 6.96 million cremations in 2022. My excess-death estimate for the Covid-19 wave is about 1.35 million (truth in statistics: 1.0 to 1.7 million). The official toll was 83,000 in-hospital deaths. They did not publish a false death count. They stopped publishing the true one.
3. The money gauge. Between 2015 and 2018 about a trillion dollars in gray outflows left China (my best estimate is $1.03 trillion, the truth-in-statistics range is 0.8t to 1.25t). A major channel was underground banks, the brokers who take someone’s yuan in Shenzhen and hand his cousin dollars in Vancouver. The state published an annual national figure for capital flight through busted underground banks. The last full-year figure covered 2016: more than 900 billion yuan in gross turnover, call it $130 billion USD. A partial figure appeared for 2017. From 2018, nothing, and 2018 is exactly where the activity it measured peaks when I rebuilt by translating and extracting data from all of their court records. The regulator’s annual reports still itemize enforcement case counts and fines, so the flattering law-enforcement statistics continue. But the embarrassing number has disappeared.
4. The courtroom record. China ran the China Judgements Online (CJO) which was the largest open judicial database on earth. I’m honestly impressed at the sheer quantity and quality of societal transparency. And then they hollowed it out. In the second quarter of 2021 the political charges started vanishing: in January 2021, 16.9 of every 10,000 published judgments were “picking quarrels and provoking trouble” cases, the catch-all charge used on protesters. By July, effectively zero. The scrub was national and uniform, and it was selective: corruption verdicts stayed up, repression came down. Outside trackers (the Dui Hua Foundation, Radio Free Asia) and a Supreme People’s Court admission bracket the same window. In January 2024 new judgments began flowing to a courts-only internal database; the public feed, already throttled since mid-2021, shrank toward a trickle. I can reconstruct all of this because the corpus was copied outside the wall before the purge: 84.5 million full-text judgments, 1985 through 2021, a public archive China built and then gutted. The archive lets you measure, independently of anything Beijing chooses to print, numbers like a criminal acquittal rate of 0.036% across 1.6 million cases. I have some other publications queued about some discoveries pulled out of their court records.
The leaning tower of corrections
Deleting public data is a loud instrument of national policy. Revising published statistics is much quieter. I built a ledger of 965 restatements of already-published figures across 11 Chinese statistical publishers; 755 of them were made silently without footnote or acknowledgment. Most revisions are innocent data maturation where they actually lean against the state’s preferred story 59% of the time. But restatements that flip the direction of a published story favor the state in 26 of 32 instances. The odds of that being random are about five in ten thousand.
My cherry picked amusing example is that if you added up provincial GDP then it was 6.9% higher than the published national GDP through 2015. That is one of the smoking guns people cite for China lying about their GDP. The 2019 accounting reform retroactively revised it out of the back-series; in today’s data the provinces sum below the national total, and the red flag has been edited out of history. The strongest evidence that China provinces once embarrasingly padded numbers was itself quietly disappeared. And fixed.
How I am adjusting my grand strategy
I am rebuilding my mental model of China around three operating rules. This is the part I expect to argue about.
1. They don’t outright lie, but they may smooth the good and the bad. For levels and long trends, Chinese official statistics should be taken roughly at face value because they survive every independent physical cross-check I could build. They’re telling the truth. Analysts who automatically discount Chinese data by 20% or 30% are making a measurable error in the wrong direction; it would be more accurate to assume their numbers are conservative and round them up. Some residual distrust is earned since the number series is twice as smooth as the economy under it so official data will confirm a Chinese recession only after it is too large to smooth with the banked under-reported good years. Use official numbers for magnitude, and use physical proxies to catch the downturns below the smoothing.
2. Key in on dying series. Stopping the reporting of a national statistic is a deliberate act of the state, and it carries a date. It points at what the leadership fears with better precision than any think-tank estimate of Chinese anxieties. Youth unemployment dying at 21.3% told you the leadership judged the labor market unfixable on any acceptable schedule. The underground-bank gauge dying after the state declared they had contained capital flight told you it was not contained. The court scrub in Q2 2021 told you repression volume had become a political liability worthy of a nationwide operation that undid their previous unprecedented transparency to combat judicial corruption. A disappearing national statistic immediately tells you where to focus your analytic efforts.
3. Collect and archive quickly. I’m honestly impressed with how transparent the Chinese government can be about some things. They publish a lot of information and you can translate it with an LLM. But their concealment is forward-looking: series stop, uploads end, and definitions change. Every deletion in this research was reconstructed because a copy existed outside the great firewall when the deleting started: a mirrored court corpus, a quarterly body count they killed three quarters too late, a vintage yearbook. The provincial-GDP episode shows they have learned to rewrite back-series. If you care about detecting deleted data, and extracting strategic or tactical insights, then you need to mirror the data before it is revised or deleted. I have been collecting a lot of published data these last few weeks.
Best Arguments Against This
The strongest argument against this piece is the form of survivorship bias that I could only compare China’s national statistics against other data that I could see. Lights, electricity, and trading partners’ import records can verify the physical economy. I could not independently measure the deflator (kinda an economist’s fudge factor) or the service sector. I estimate the current GDP numbers are about 4% high today with a truth-in-statistics range of 0% to 10%; the numbers are plausible and unprovable. I mostly agree. They are smoothing these numbers over time. The long term topline numbers are honest. The peaks and valleys are deleted.
The second argument is that statistical agencies everywhere retire series, and a register of dead ones proves selection, not suppression. My case rests on a small sample size. In the six natural experiments where a bureau published dual series where one was embarrassing, and one was favorable, they deleted the embarrassing one in all six instances. It’s not a smoking six-shooter. But it is smoking.
What would change my mind, with dates attached: if reported GDP growth and the electricity-and-lights pair diverge by more than about two percentage points cumulatively over 2024 through 2027, then the honesty baseline is breaking. If the 2030 census counts child cohorts more than 10 million away from the school-roll reconstruction, or the 2026 or 2027 school-roll numbers diverge materially from the two further years of local police station birth registrations then the population debunk fails. If the statistics bureau restores the original-definition youth unemployment series with backfilled data, the way the Gini coefficient came back in 2013, I will downgrade deletion from a terminal signal to a pause. And if vanished series start being scrubbed from internet archives retroactively at scale, the forward-only model is dead and the mirror-everything strategy has an expiration date.
The numbers were never the lie. The silence is.
A note on method and AI use
I orchestrated AI agents across three research programs for the analysis behind this piece. The hypotheses and the conclusions are 100% mine. The data included a satellite record of the planet’s nights at about 2.5 billion pixels a year, the Ministry of Education’s enrollment tables, foreign-exchange and enforcement records, a hand-adjudicated ledger of 965 statistical restatements, a register of 28 terminated series with a per-row evidence trail, and a mirrored corpus of 84.5 million court judgments from the public archive China built and later gutted. Local models did the translation and bulk extraction. The agents did the reading. I did the thinking.