Jumping the track from a legacy to an AI‑First organization
BLUF: The lesson from tech companies is scale plus heavy, compounding reinvestment in innovation


I’ve been running a bunch of research side quests trying to no-kidding understand how one would build and manage an AI‑First organization; not just incorporating vibe coding into existing projects. I’m finding that managing AI-native processes is eerily like managing technology organizations… with the obvious cognitive-bias risk that I’ve been managing technology organizations for a while.
So here’s the working assumption (call it a hypothesis, not a law): real AI‑First organizations will resemble high-performing technology companies. If that’s even partially true, what do tech companies actually prioritize and what should evolving organizations project into an AI‑First future? And to say the quiet part out loud, most organizations will soon claim to be AI‑First. I want a rubric to quickly ignore the strap hangers.
A quote I’m going to channel (often attributed to James W. Frick) is: Don’t tell me where your priorities are. Show me where you spend your money and I’ll tell you what they are.
I’m going to use changes in corporate expenditures as a proxy for prioritization. This proxy is imperfect (prices move, accounting moves, definitions move), so I’ll keep separating what the data shows, versus what I’m inferring.
Conclusions up front for those who want to TL;DR. Becoming an AI-First organization jumps onto three tracks:
measurable output-per-person gains across the entire headcount
leaner and higher-leverage management
sustained investment in building capabilities
Let’s start working top down from macro economics towards the broader workforce.
Baselines: inflation and money supply
My heuristic: when an expense category grows materially faster than inflation for long periods, that’s at least consistent with increased corporate strategic prioritization, unless there’s strong external stimuli such as regulation, accounting, labor shocks.
Inflation (CPI) is a measure of average price changes paid by urban consumers.
M2 is a broad measure of the U.S. money supply.
From Dec 2003 to Dec 2024, CPI rose about 1.71× and M2 rose about 3.53×. You’ll see this throughout the graphs as baselines to contrast corporate changes against.
(One caveat: the Fed’s published definitions around M1/M2 were updated in 2020; the series is continuous, but readers should know there was a definitional change under the hood.)
Does Capital Management Set Strategic Priorities?
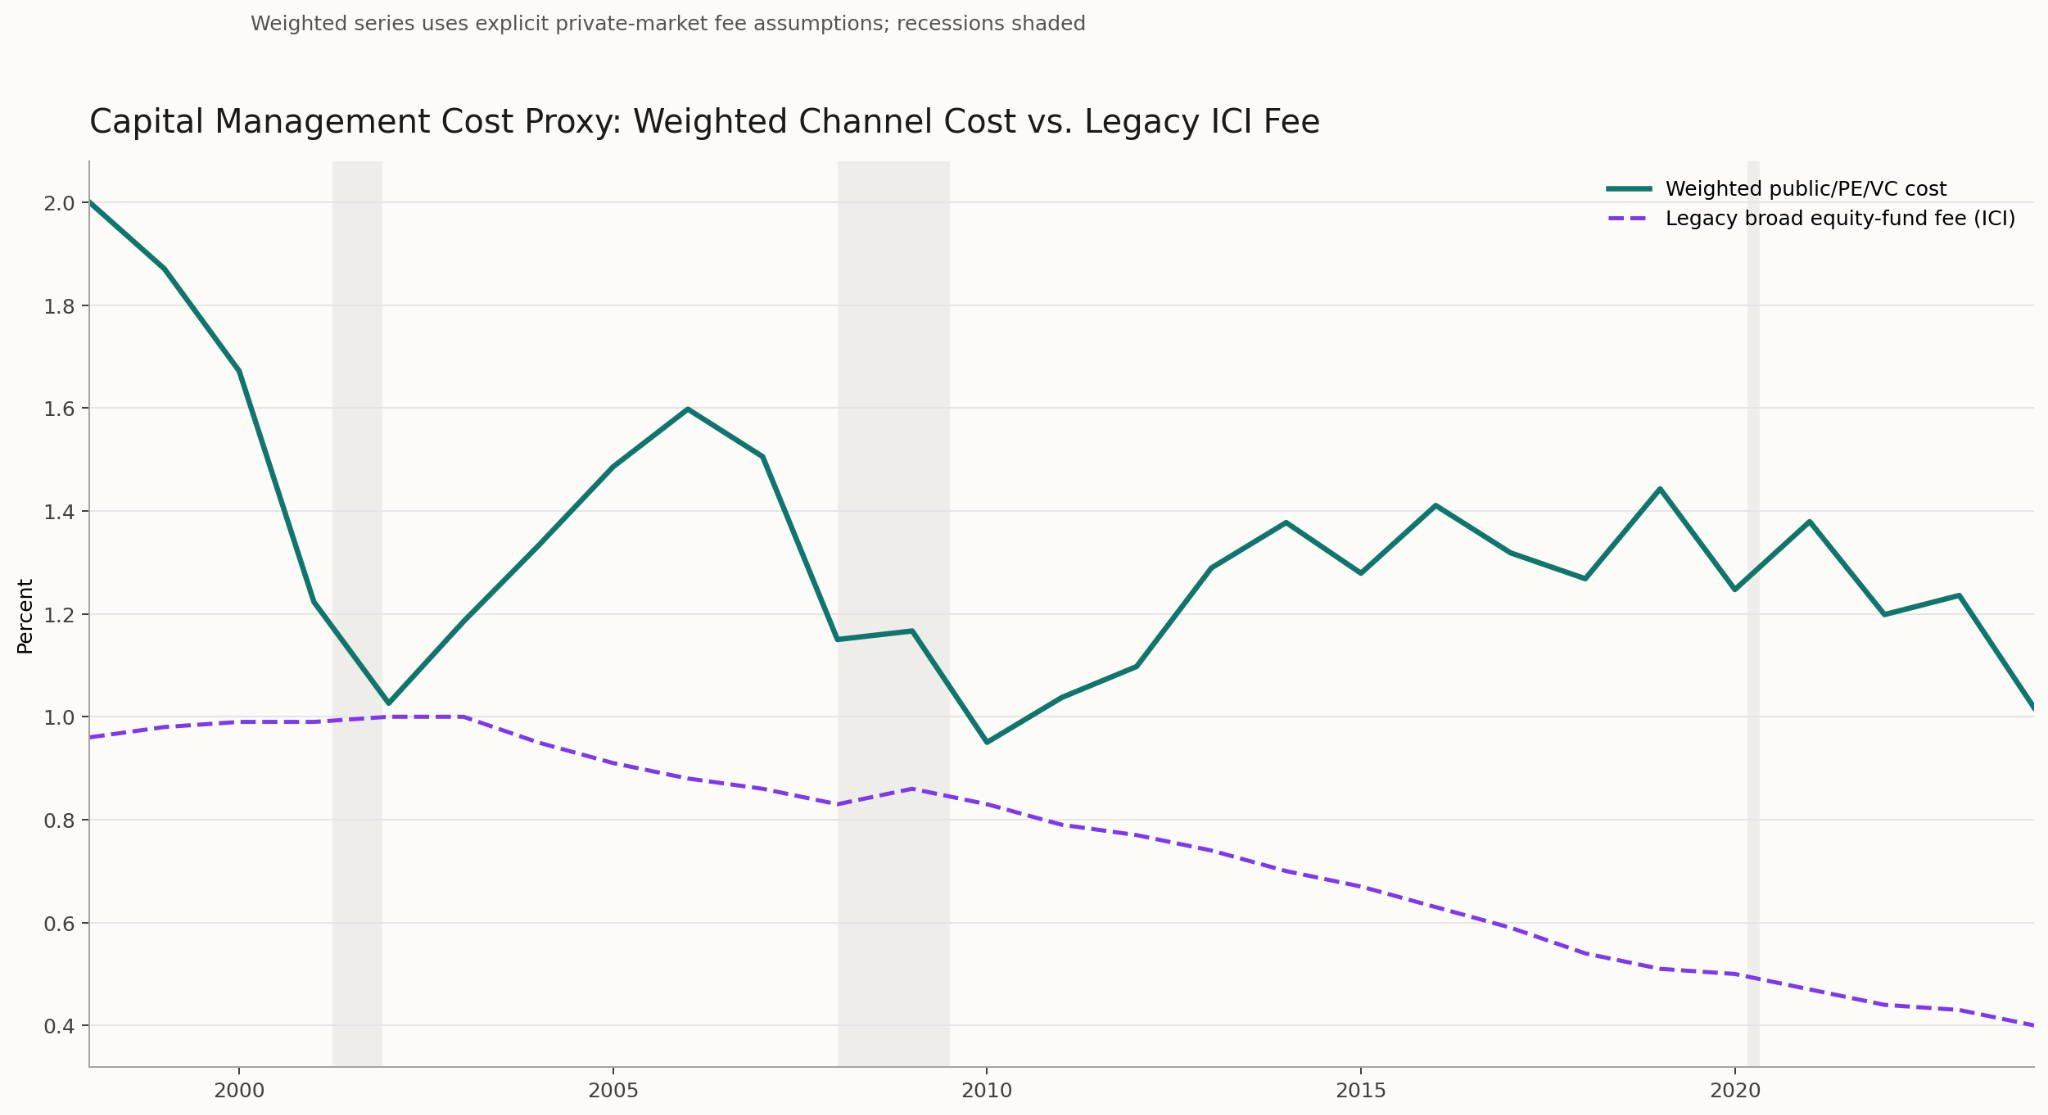
Effectively: are we seeing increasing or decreasing costs in paying intermediaries to manage capital? Which would implicate if investors are prioritizing intermediaries setting the strategic direction of technology companies; or conversely, the technology companies are setting their own strategic direction.
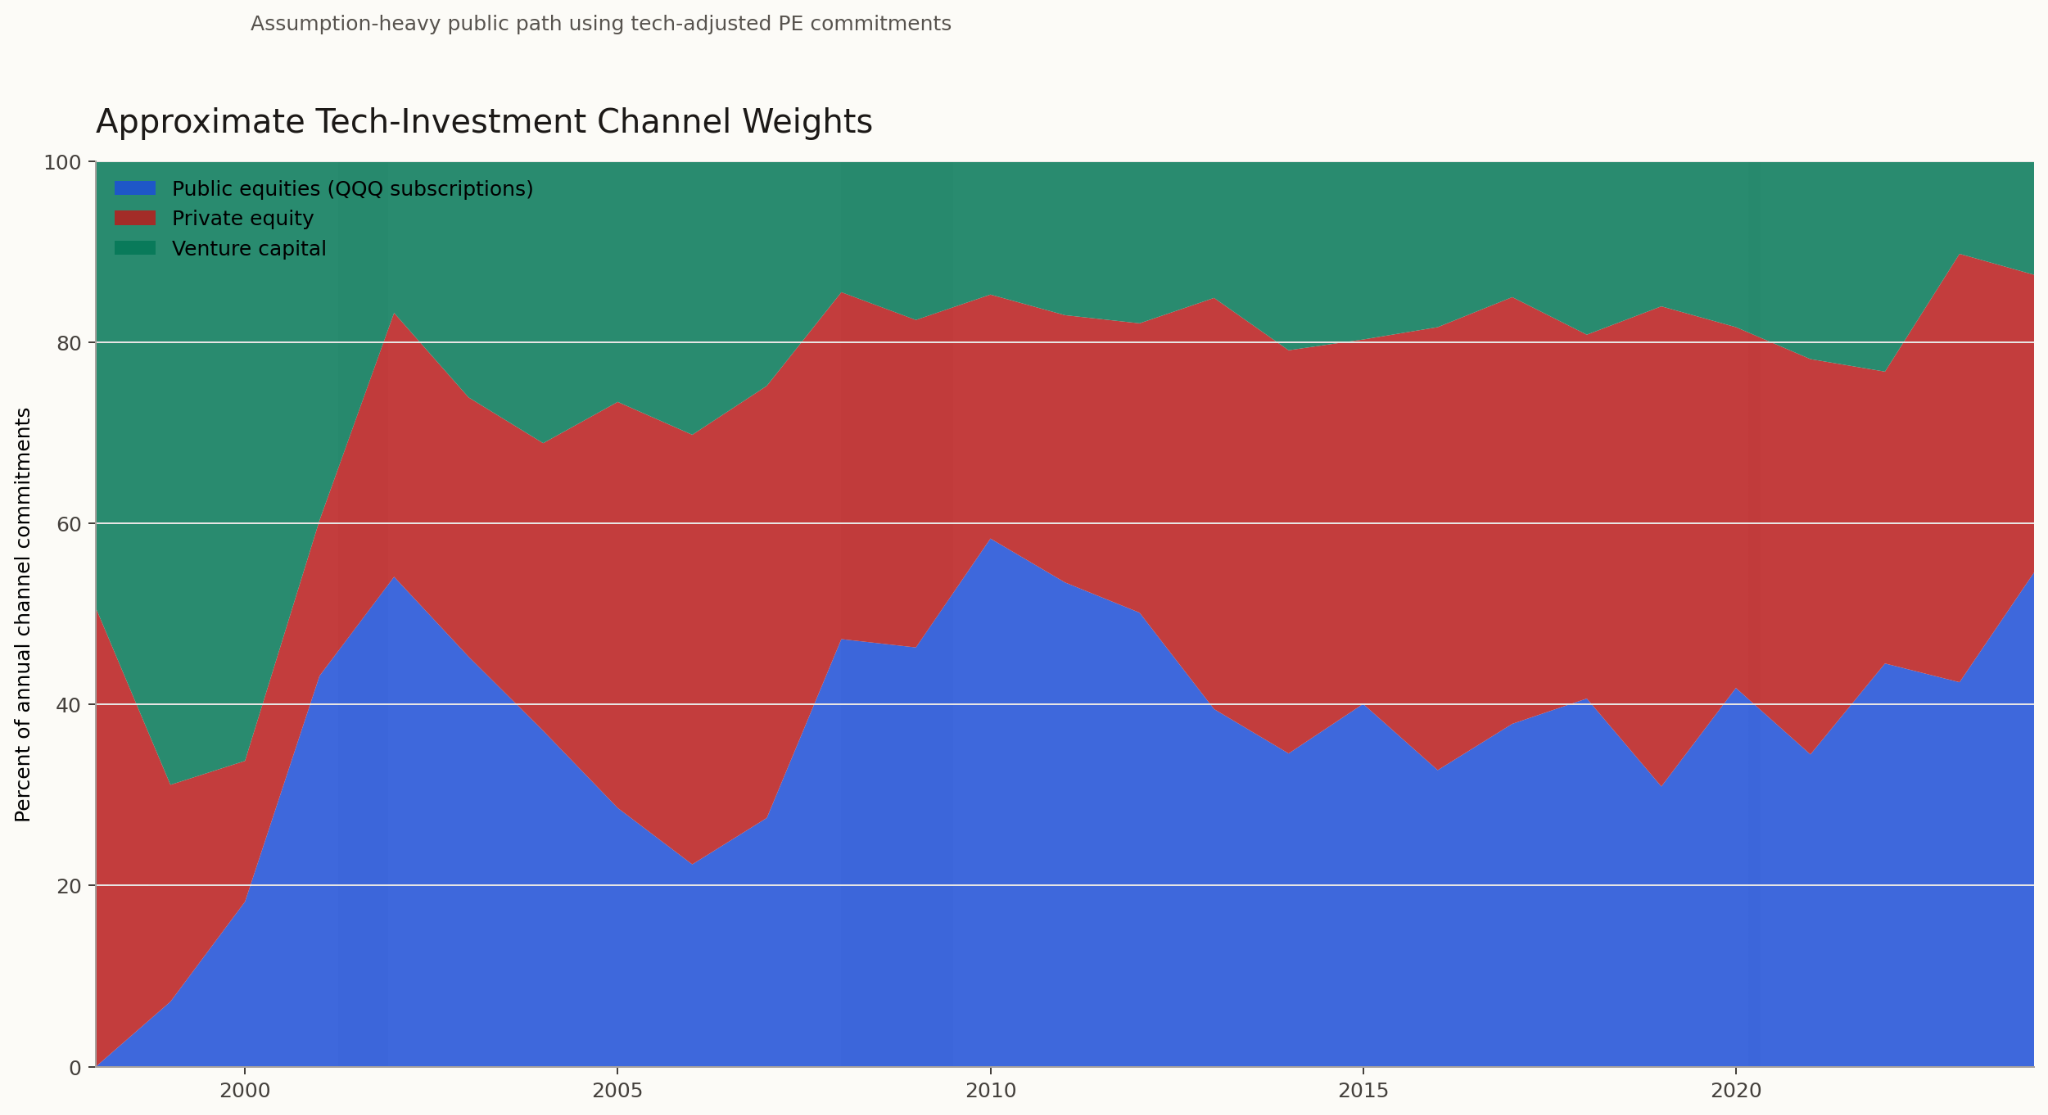
I broke this into public markets, private equity, and venture capital. The graph below shows the approximate breakdown over time.
For public markets I used QQQ expense ratios as a simple proxy. QQQ is an ETF based on the Nasdaq‑100 Index and the largest technology focused ETF by far.
For private markets, I used a simplified fee model (stylized “management fees,” not a full accounting of carry and all other fees. Real private fund economics are messier than a single percent).
I was expecting to see data indicating there was too much investment capital chasing too few quality investments, that shareholders and VC/PE limited partners were placing an increasing priority on capital management as represented by increasing fees, and that could indicate more investors took a more active role in setting corporate strategic priorities. I did not see that. And I admit to being quite surprised.
Executive pay: is it exploding [in priority]?
Public perception says CEO pay is out of control. Long-run datasets often show dramatic growth since the late 1970s, though results vary by sample and pay definition (granted vs realized).
For this draft, I extracted “total compensation” from proxy statements for Nasdaq‑100 constituents and compared it to CPI and M2. Fortunately, SEC rules require detailed executive-comp disclosure.
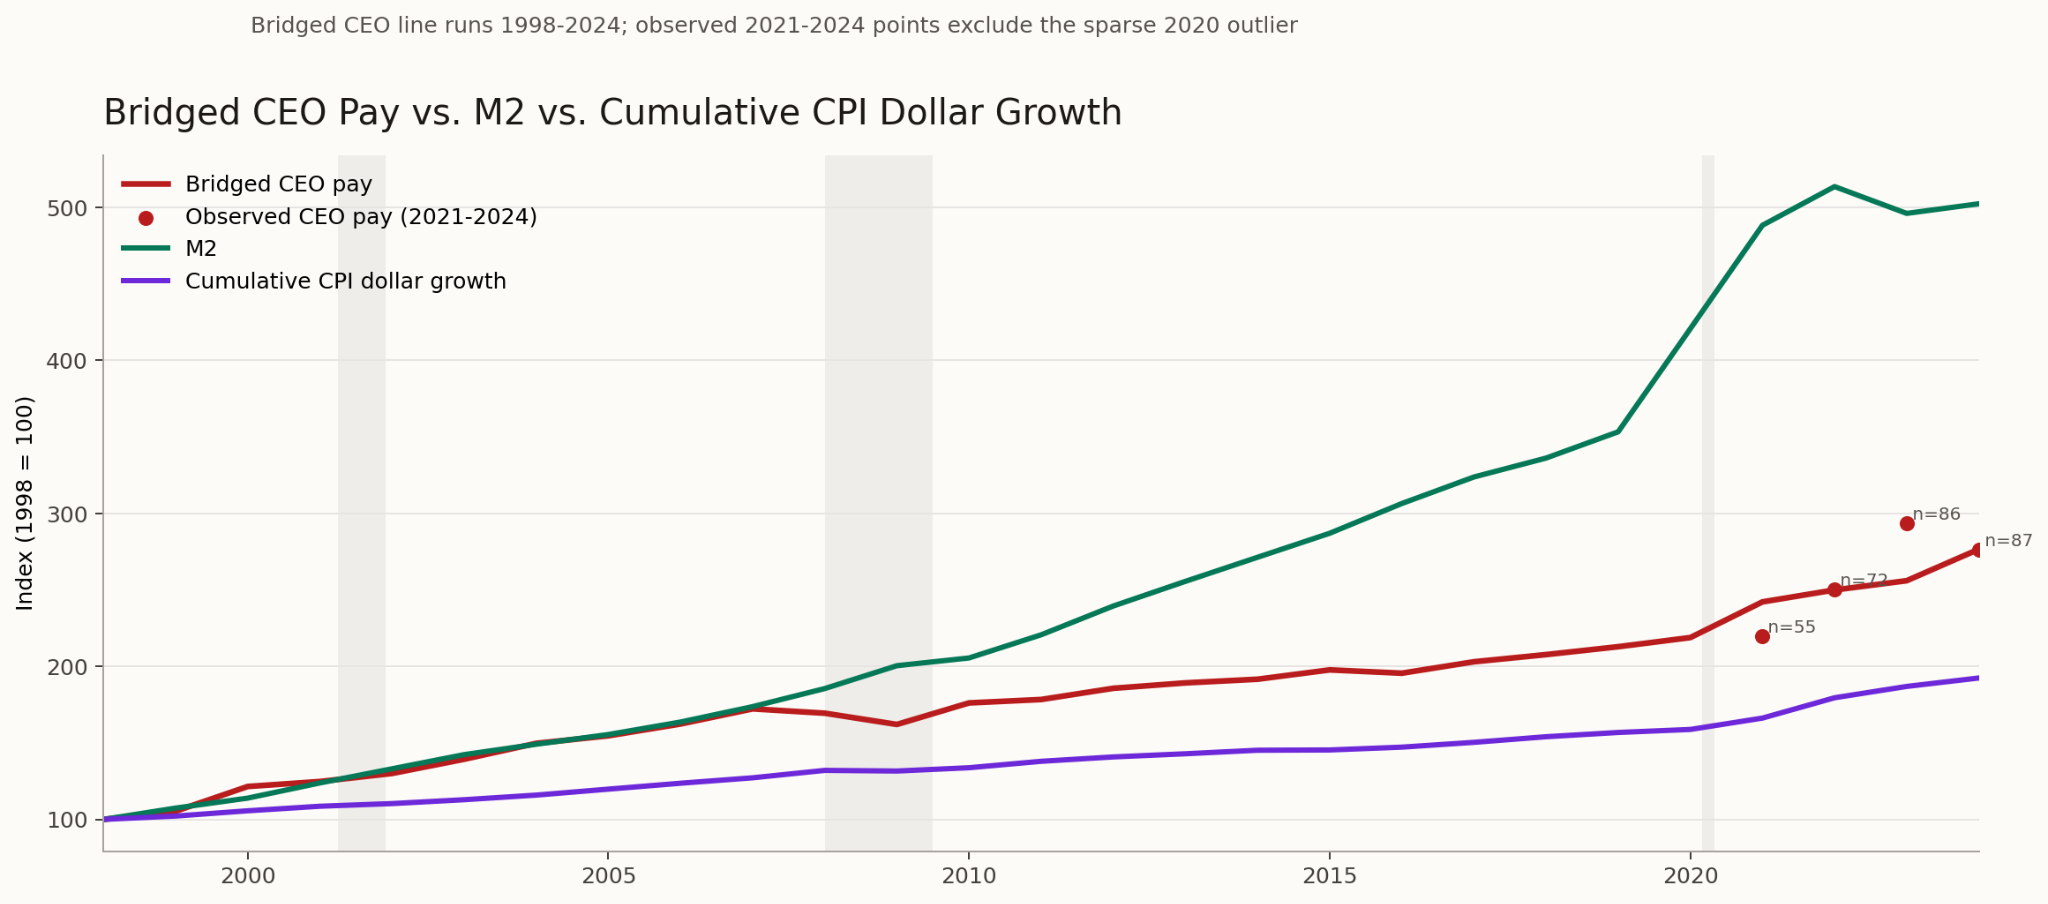
In my series, CEO and named executive “total comp” rises much closer to CPI than to M2. So by my model, quality executives are an increasing corporate priority but nowhere near as much as things we’ll see later.
That surprised me. But I’m also not going to pretend “total comp” is the same as realized wealth. The proxy “total” commonly includes equity awards valued at grant date under accounting rules. And the founders’ net worth is typically driven more by the value of their founders stock than any form of compensation.
Middle management: fewer managers, higher pay, more productivity?
Next I looked at middle management using the Current Population Survey (sponsored by BLS and conducted by the Census Bureau).
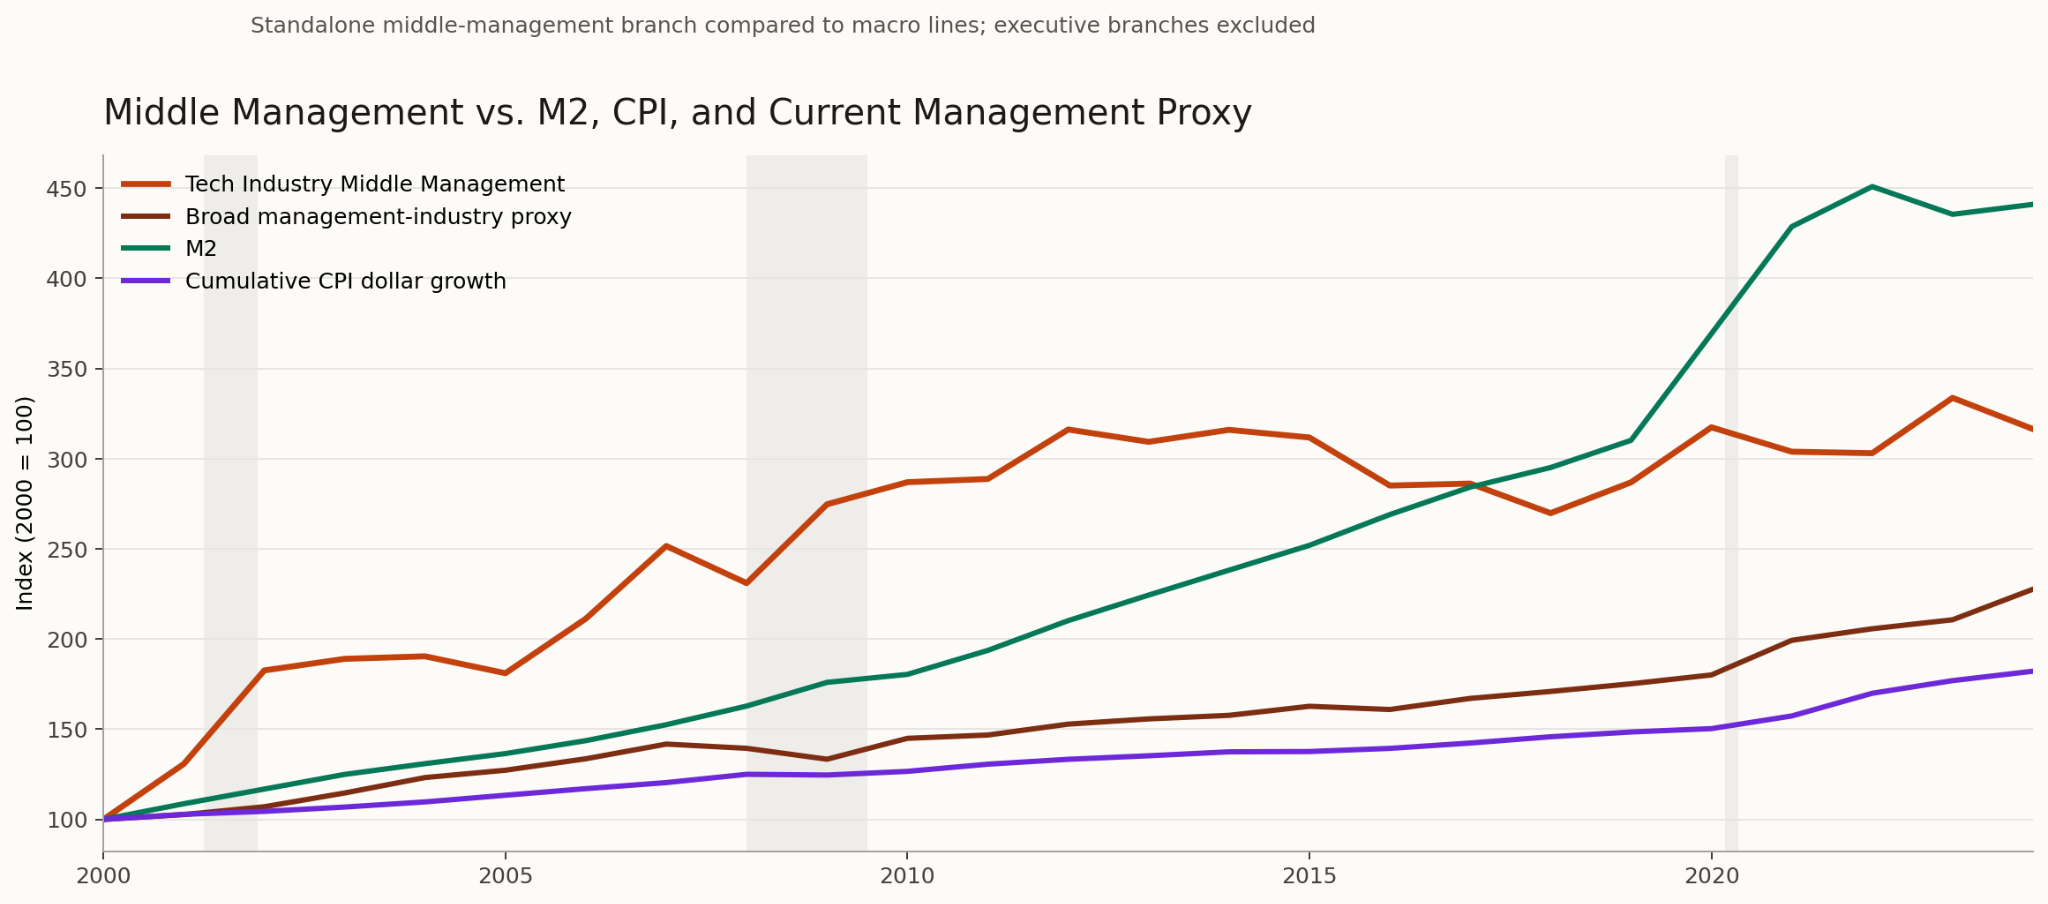
The middle management inferences are subtle. The graph above shows a flat middle management cost since the 2010s.
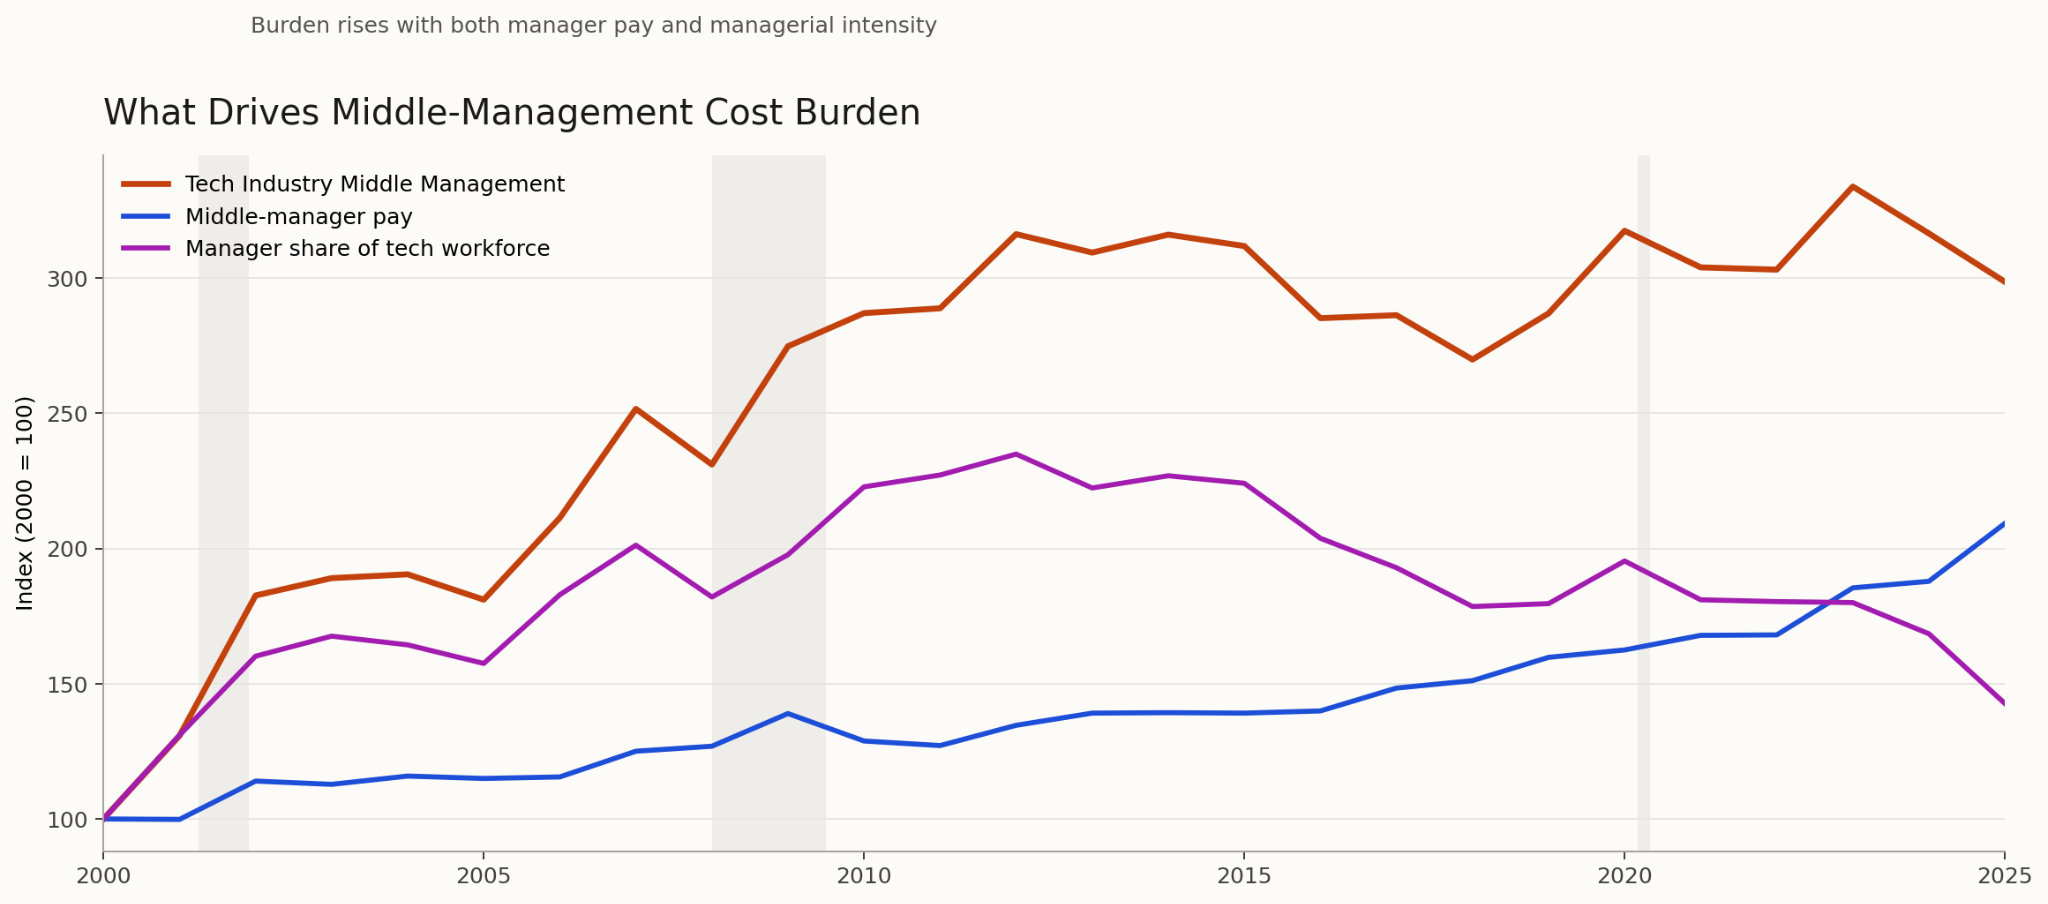
Digging deeper we can see technology companies prioritize “better, but less, middle management”. Since the early 2010s: the total middle management cost is flatter while the headcount falls and pay rises. Because “middle manager” definitions can be slippery (titles inflate; roles change), this needs to be read as a proxy, not gospel.
AI‑First implication: if tech incumbents are successfully doing more with fewer managers, AI‑First orgs should treat management effectiveness and span-of-control design as a first-class problem and not an HR afterthought.
Technical workforce: scaling people faster than “per-person” cost
Technical headcount data is sparse and messy. I built a cohort from the subset of Nasdaq‑100 firms that published consistent disclosures: Apple, Adobe, Applied Materials, Amazon, Cisco, Intel, KLA, Microsoft, Nvidia, Qualcomm, and Texas Instruments. Then I excluded Amazon from some technical headcount aggregates because their non-tech operational headcount dominated the denominator.
From 2003–2024, the macro baselines are:
M2: ~3.53×
CPI: ~1.71×
My cohort outputs (from public disclosures) were directionally:
headcount growth well above CPI, closer to M2,
per-person compensation closer to CPI.
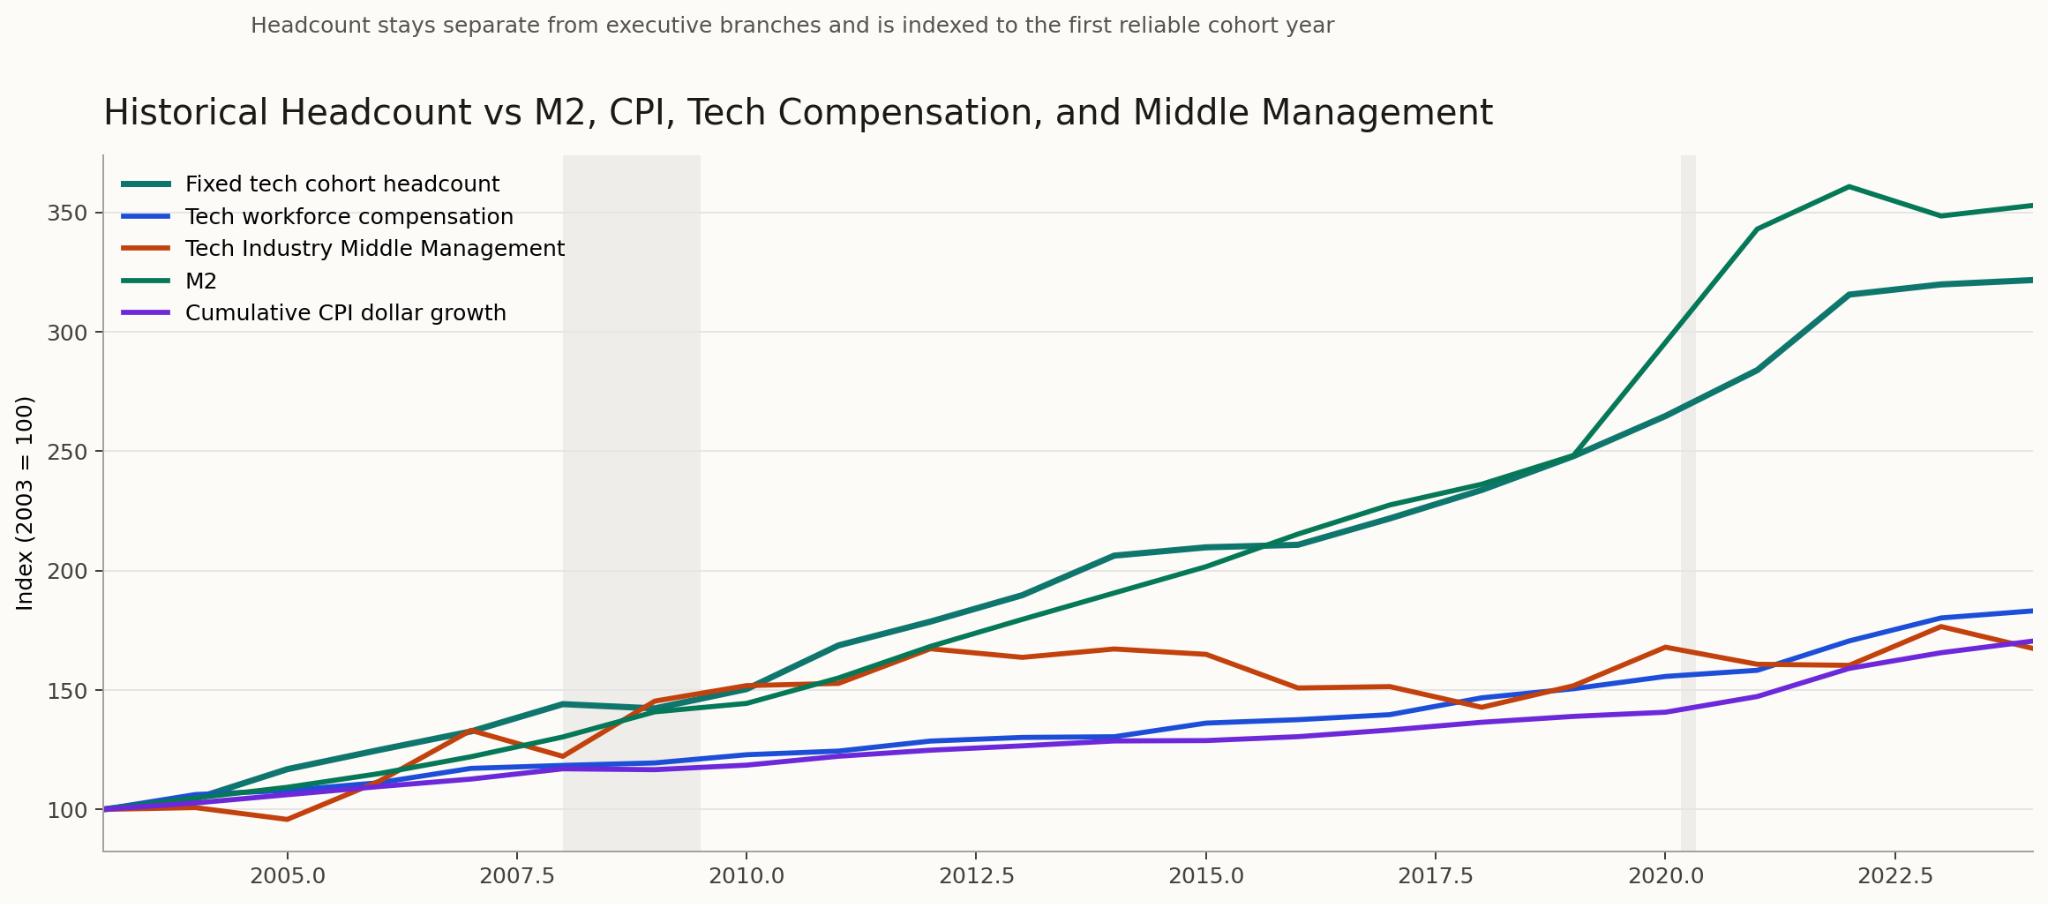
That’s consistent with “scale primarily came from hiring more people”. The conclusion is that tech companies are greatly prioritizing performing more work and they have solved it by hiring more workers. I do not have data to infer changes in engineers productivity.
AI‑First conclusion: If existing organizations want “better workforce” rather than “bigger workforce,” AI has to show up as measurable output-per-person gains, not just more hires and more tools.
AI‑First conclusion: I had to exclude Amazon because their non-tech headcount dominated the denominator. An objective of an AI-First mutation of organizational DNA should be the opposite where some of the measured outputs-per-person divides by zero.
Output: revenue, profit, and the moat question
For this cohort, revenue and net profit growth outpaced CPI and exceeded most internal cost curves in the same indexed view.
I also sanity-checked enterprise value (EV). EV is typically equity value plus debt minus cash (with some nuances). EV is market pricing so it will move on expectations and rates, not just present earnings.
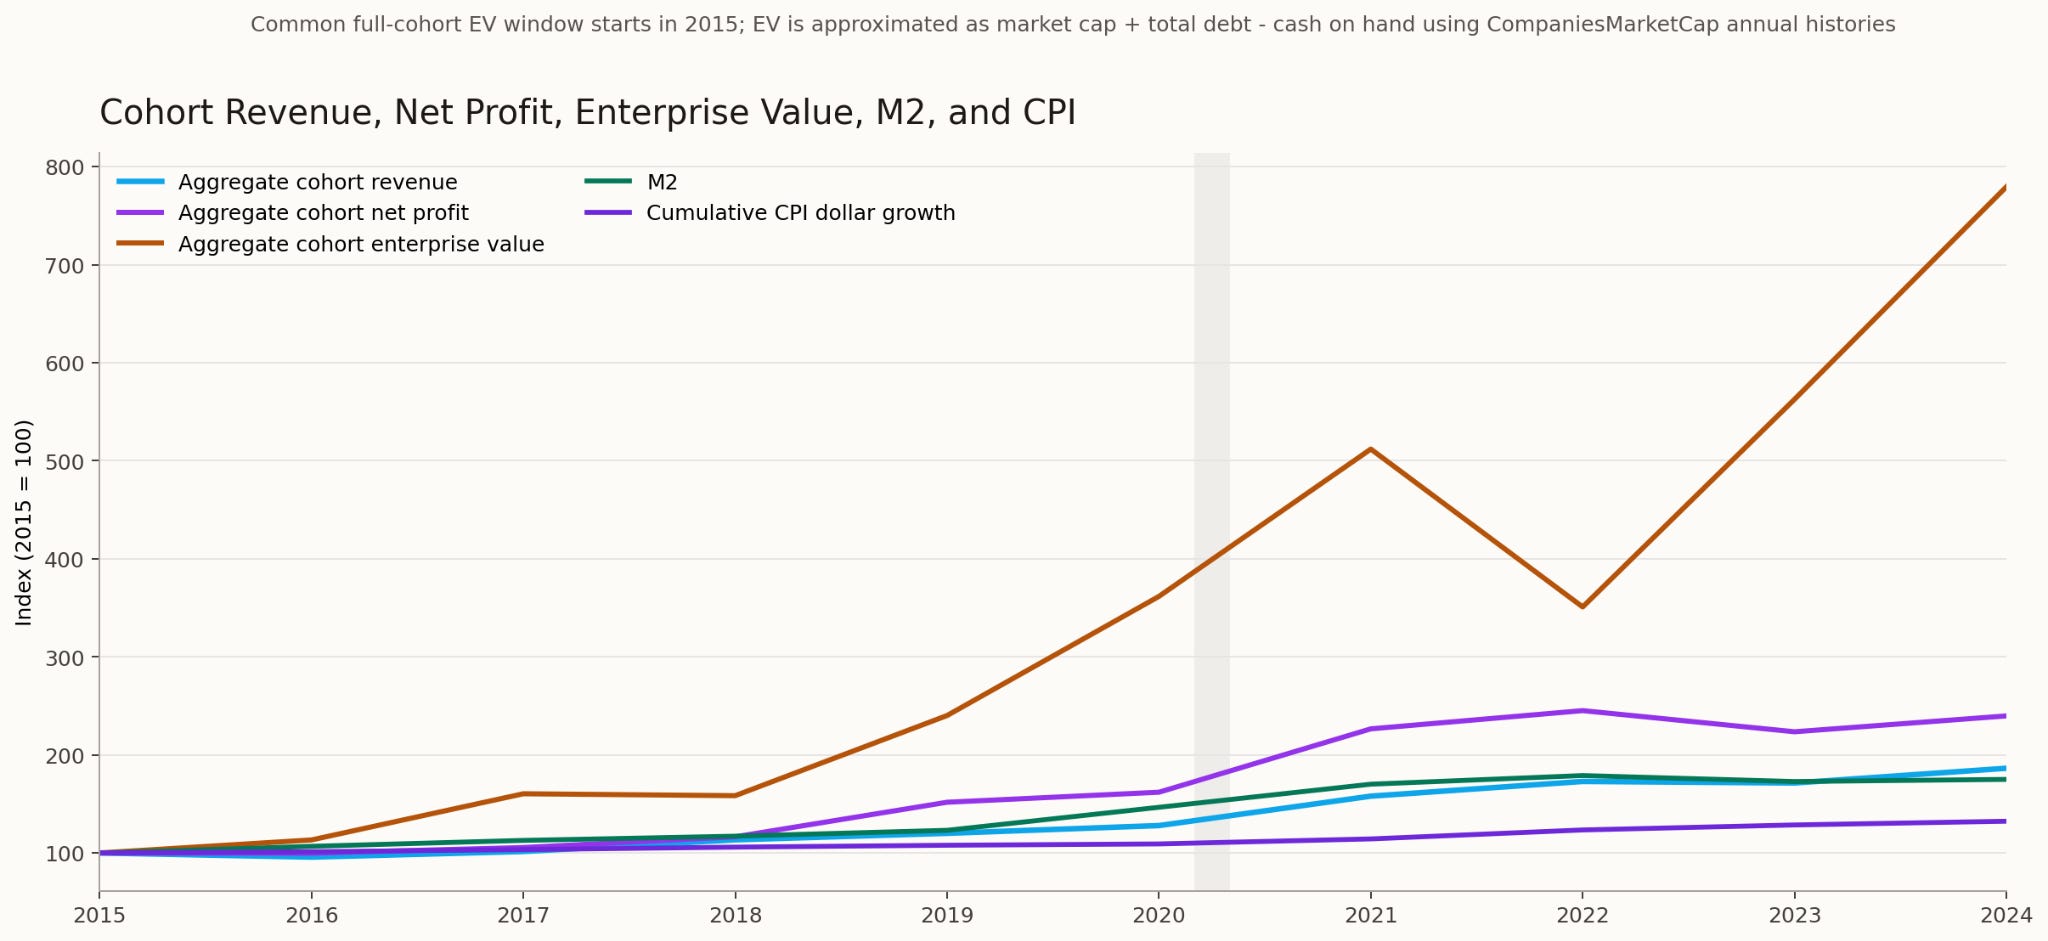
I’m not drawing big conclusions from my EV plot here; it’s more a reminder that markets price expected future cash flows, not just what happened on the income statement, and it doesn’t correlate with any of the data measuring the past or present.
Innovation and R&D
Next: R&D spend. Two important caveats before anyone treats “R&D expense” as “innovation spend”:
accounting category ≠ innovation outcome, and
tax policy can change the incentives and timing around R&D deductions/expensing and research credits.
In the U.S., tax treatment changed in ways that affected timing starting in 2022, and later shifted again in 2025 to restore domestic expensing. It’s analogous to suddenly only being able to claim 1/30th of the mortgage interest on your house on your yearly taxes.
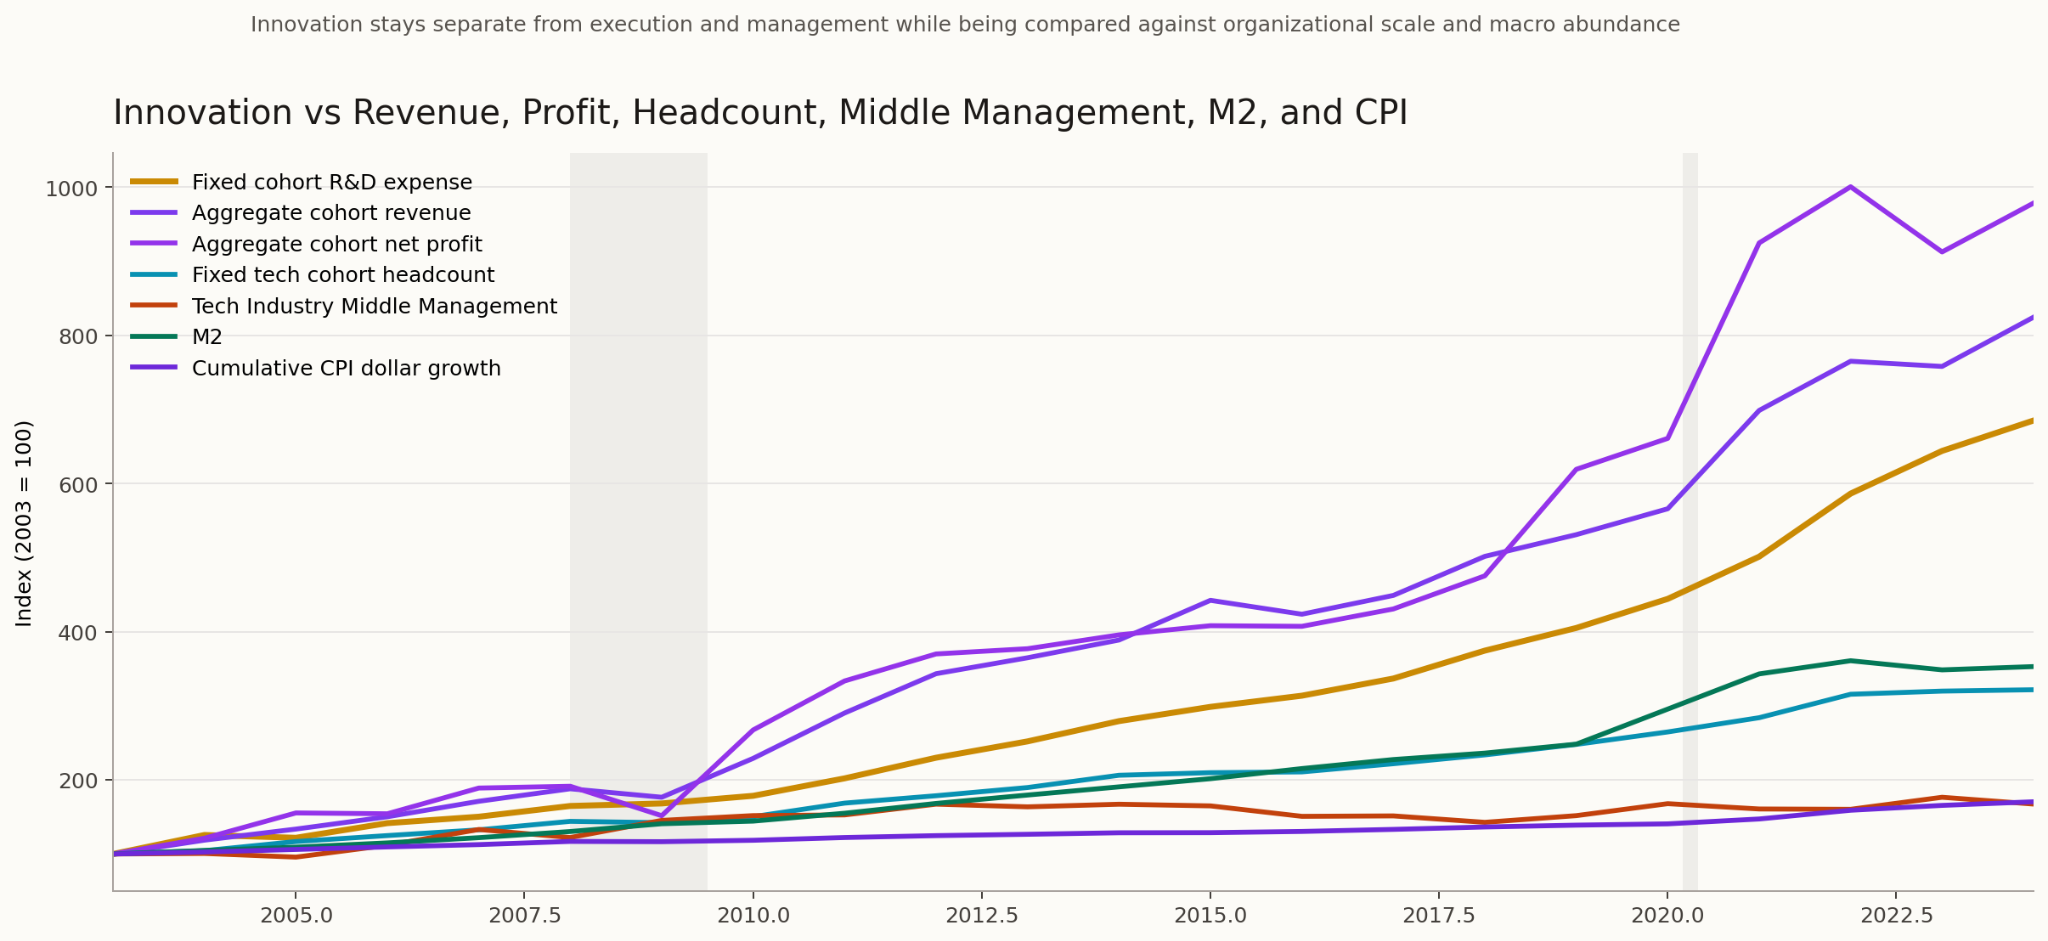
Under these caveats, my extracted R&D series rises far faster than CPI and faster than M2 over the post‑2003 window, and almost tracks the rise in revenue and profit. This is consistent with “innovation allocation” being the major increasing long-run priority in big tech.
AI‑First takeaway: The pre‑AI‑First tech pattern wasn’t only scale expansion; it was scale expansion plus large, compounding reinvestment into R&D. AI‑First organizations should expect the same: rising investment into capability creation, but with ruthless measurement of output.
Conclusion
Most organizations are about to call themselves AI-First. Most of them will just be legacy organizations with AI stapled to the side. The real transition will not show up first in branding, keynote demos, or a pile of copilots dropped into old workflows. It will show up in the operating model. It will show up in where the company spends money, how it is structured, and whether output actually changes.
That is the core lesson from the technology-company pattern. The long-run winners look like organizations that kept output compounding, got more selective about management, and reinvested heavily into capability creation. The uncomfortable part is that pre-AI-first tech mostly solved growth by hiring more people, not obviously by making each person dramatically more productive. That is exactly the pattern an AI-First company should try to break.
So the rubric is simple. Ignore the slogan and follow the budget. If headcount keeps climbing, management layers stay thick, and AI spending lands as just another software line item, then nothing fundamental changed. If the organization gets flatter, managers can effectively handle wider spans of control, capability creation keeps compounding, and output per person rises in a way that can be measured, then the organization is actually mutating into something new.
That is the standard. Not “are we using AI?” but “did AI fundamentally change the mission workflow?” The organizations that can answer yes will not just staple AI over the last rebranding. They will jump the track.