I Built a Macroeconomic Model. It Handed Me a Target Package
Macro, cyber, macro. 422 studies, 89 scenarios, 10,000 futures, and one sequence that kept repeating.

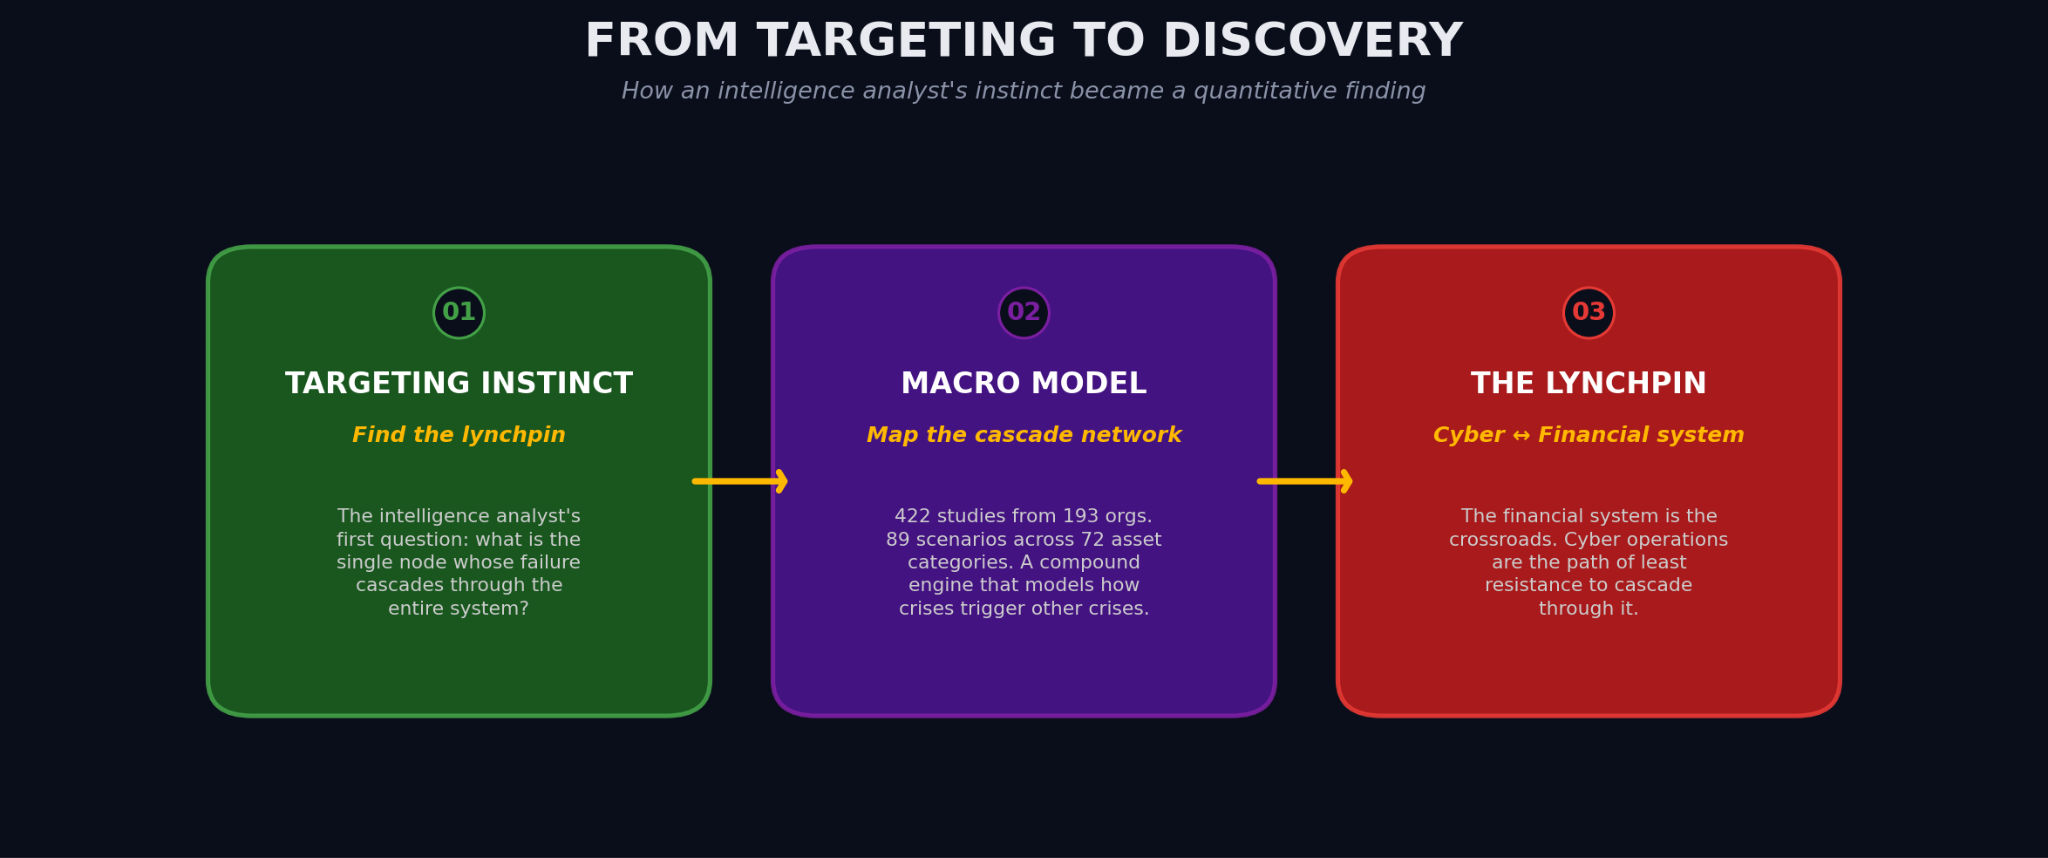
I used to spend a lot of time with my head buried in classified intel, building mental models of targets to find the lynchpins; the nodes where a small, well-placed effect cascades into disproportionate impact. It’s a specific kind of thinking. You learn to see organizations as interconnected dependencies, and you learn that the interesting question is never “what’s the biggest thing?” but “what’s the thing that, if it moves, makes everything else move?” Then as a hacker you go kick over that lynchpin. I just tripped over one that I wasn’t looking for.
This month, I built a macroeconomic model. Not to predict markets, but to understand how the structure of the world is changing and how common financial wisdom holds up against it. I synthesized a model from 422 studies published from organizations like the IMF, BIS, Federal Reserve, World Bank, IEA, IPCC, RAND, NATO, and CSIS into 89 scenarios, booms and busts, each with calibrated probabilities, persistence, and cascading dependencies across 72 asset categories.
Somewhere around the tenth Sankey diagram, my heart stopped.
The same targeting instinct that used to drive cyber capability development and operational planning had just, independently, identified cyber operations against the financial system plumbing (macro-financial) as the single highest-leverage cascade node in the modeled world economy. Not because I asked it to. Because that’s what the data said. If we need to concentrate defensive resources, the place to concentrate our forces is the financial system.
This post is about what else the model found, and why I think common financial wisdom is now load-bearing on assumptions that no longer hold. But the part I can’t stop thinking about is the cyber part. I’ll come back to it.
The baseline is not your friend
History doesn’t repeat itself, and it no longer rhymes.
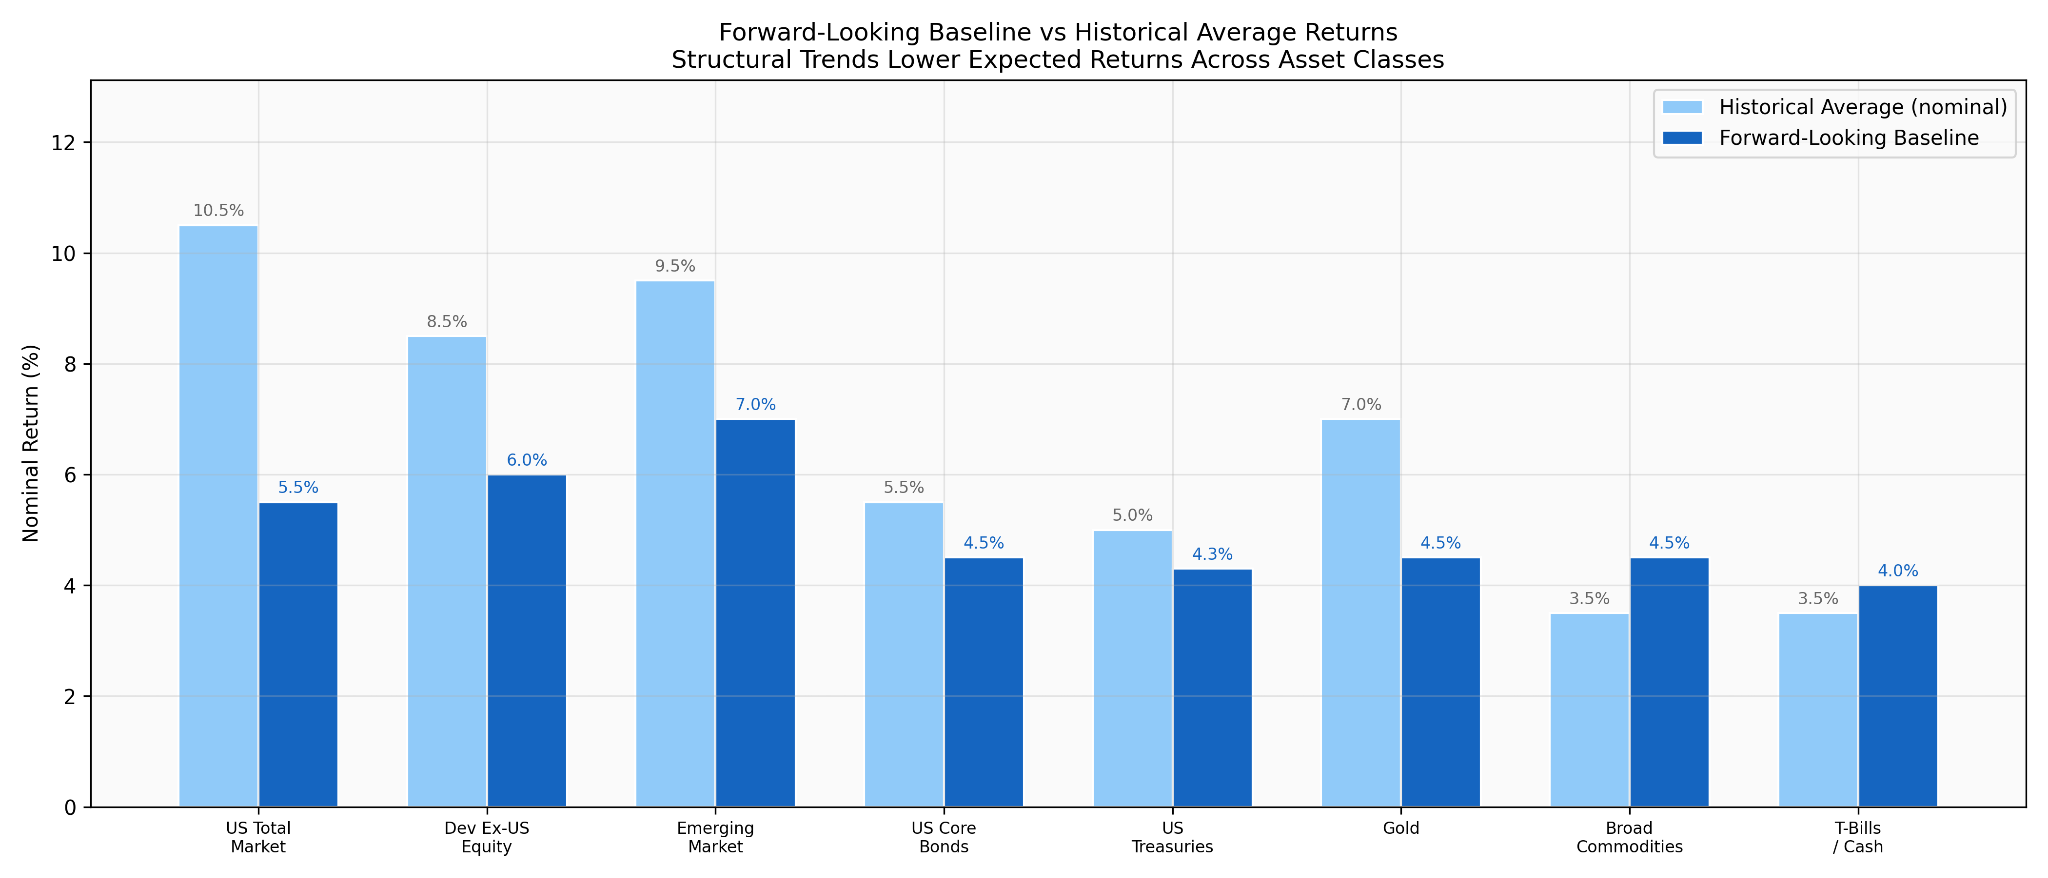
The standard move in financial planning is to assume historical returns, roughly 10.5% nominal for U.S. equities, 5.5% for bonds, will continue. That assumption is built on a world of strong institutions, stable trade, manageable sovereign debt, benign demographics, and a relatively quiet geopolitical backdrop. Every one of those is visibly changing.
The institutional literature is consensus on the direction, if not the magnitude. Aging populations reduce labor-force growth and productivity. Equity markets start from historically elevated valuations. Trade fragmentation raises costs. Sovereign debt loads crowd out private investment and create inflation pressure. Climate transition is a structural drag. Entitlement programs face insolvency timelines that force either benefit cuts or tax increases.
None of these are speculative. They’re the consensus of institutional research. When you aggregate them against the literature, forward-looking equity returns drop from the historical ~10.5% to roughly 7%, and bonds from ~5.5% to ~4%. That alone makes plans built on historical averages optimistic before a single surprise event is added.
But structural drift is the boring part. The interesting part is what happens when the surprises start to cluster.
89 black swans, and why they cascade
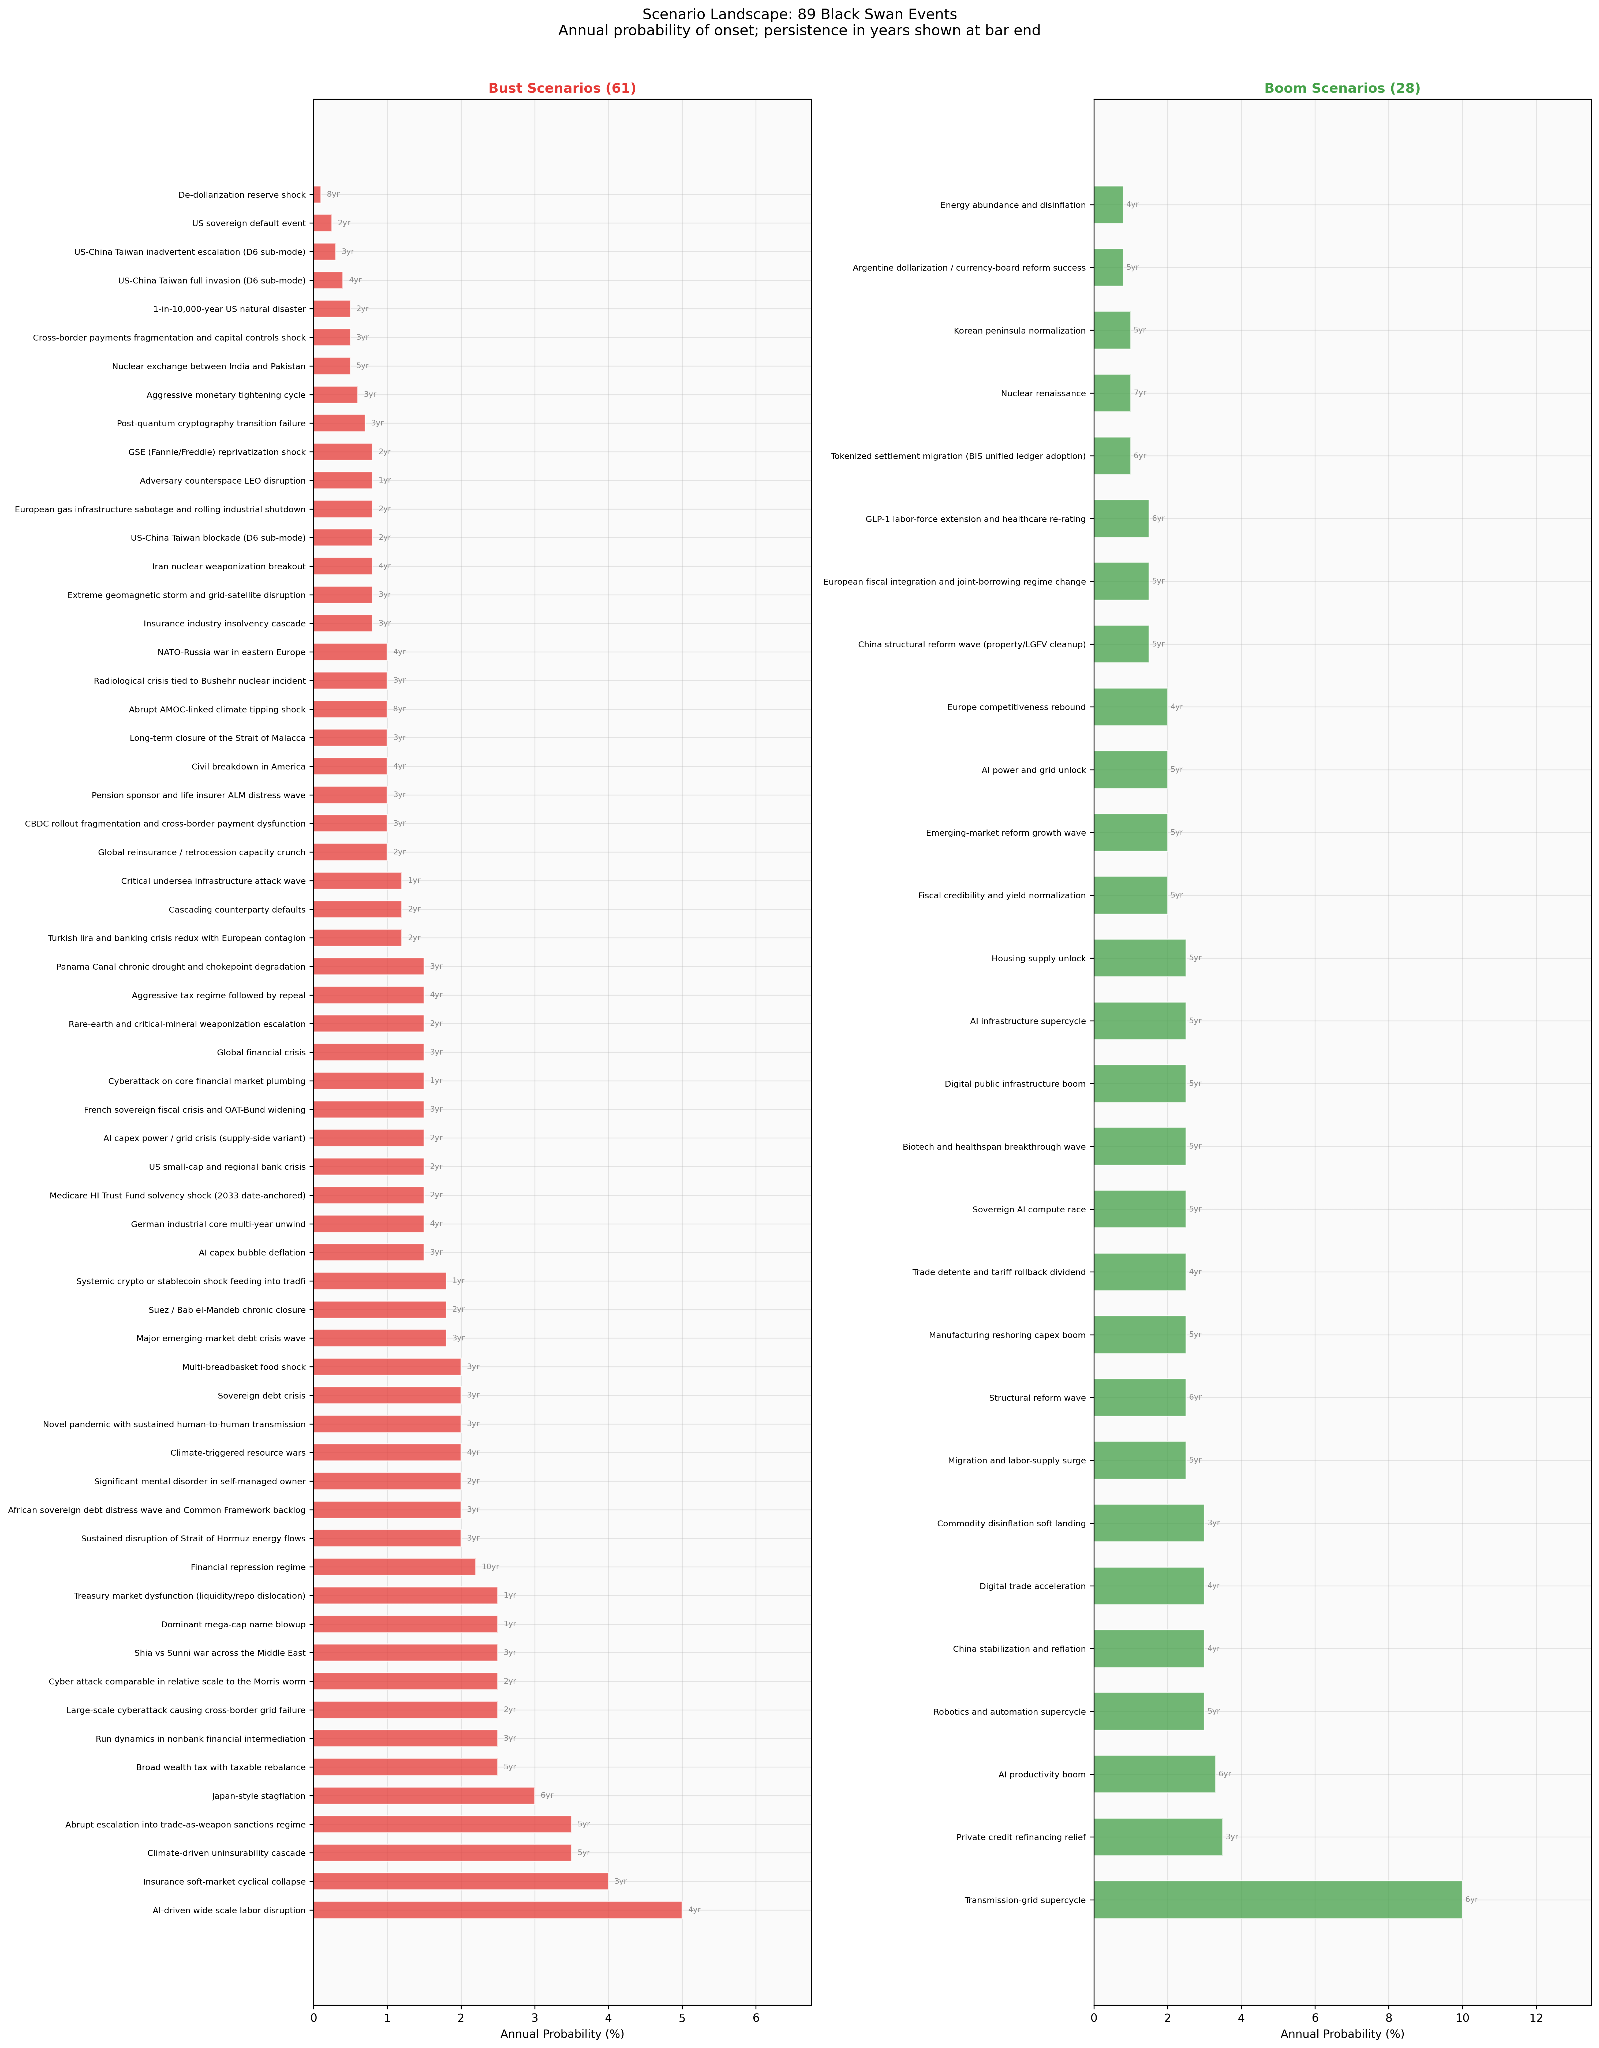
I modeled 89 scenarios (61 busts, 28 booms) drawn from the same research base. Each has a calibrated annual probability, a persistence duration (1 to 10 years), and a shock profile across all 72 asset categories. Annual probabilities range from 0.5% for a nuclear exchange to 10% for a transmission-grid infrastructure supercycle. Scenarios are what the literature models, which means they carry an implicit bias toward what foundations, donors, and governments were worried enough to fund studies on. That’s a limitation, but it’s also a feature: these are the events that institutional researchers thought were worth calibrating.
The standard way to use a scenario library is to fire one at a time and measure the impact. That’s what most stress tests do. It’s also the part that misses what actually matters.
The scenarios cascade.
The way society and government respond to one event often creates the conditions for the next. A macro-financial crisis makes tax-regime shocks and structural disruptions more likely. Geopolitical wars spill into supply-chain disruption and cyber operations. Climate shocks feed into resource conflicts and biosecurity risks. I built a spillover model, family-to-family probability multipliers grounded in historical sequences, and ran 10,000 Monte Carlo paths through three modes: bust-only (downside clustering), boom-only (upside clustering), and mixed (both).
In the mixed mode, 91% of paths produce multi-scenario cascades. In bust-only mode, 67%. These aren’t cherry-picked narratives. They’re what the engine produces when you let it run.
The Sankey moment
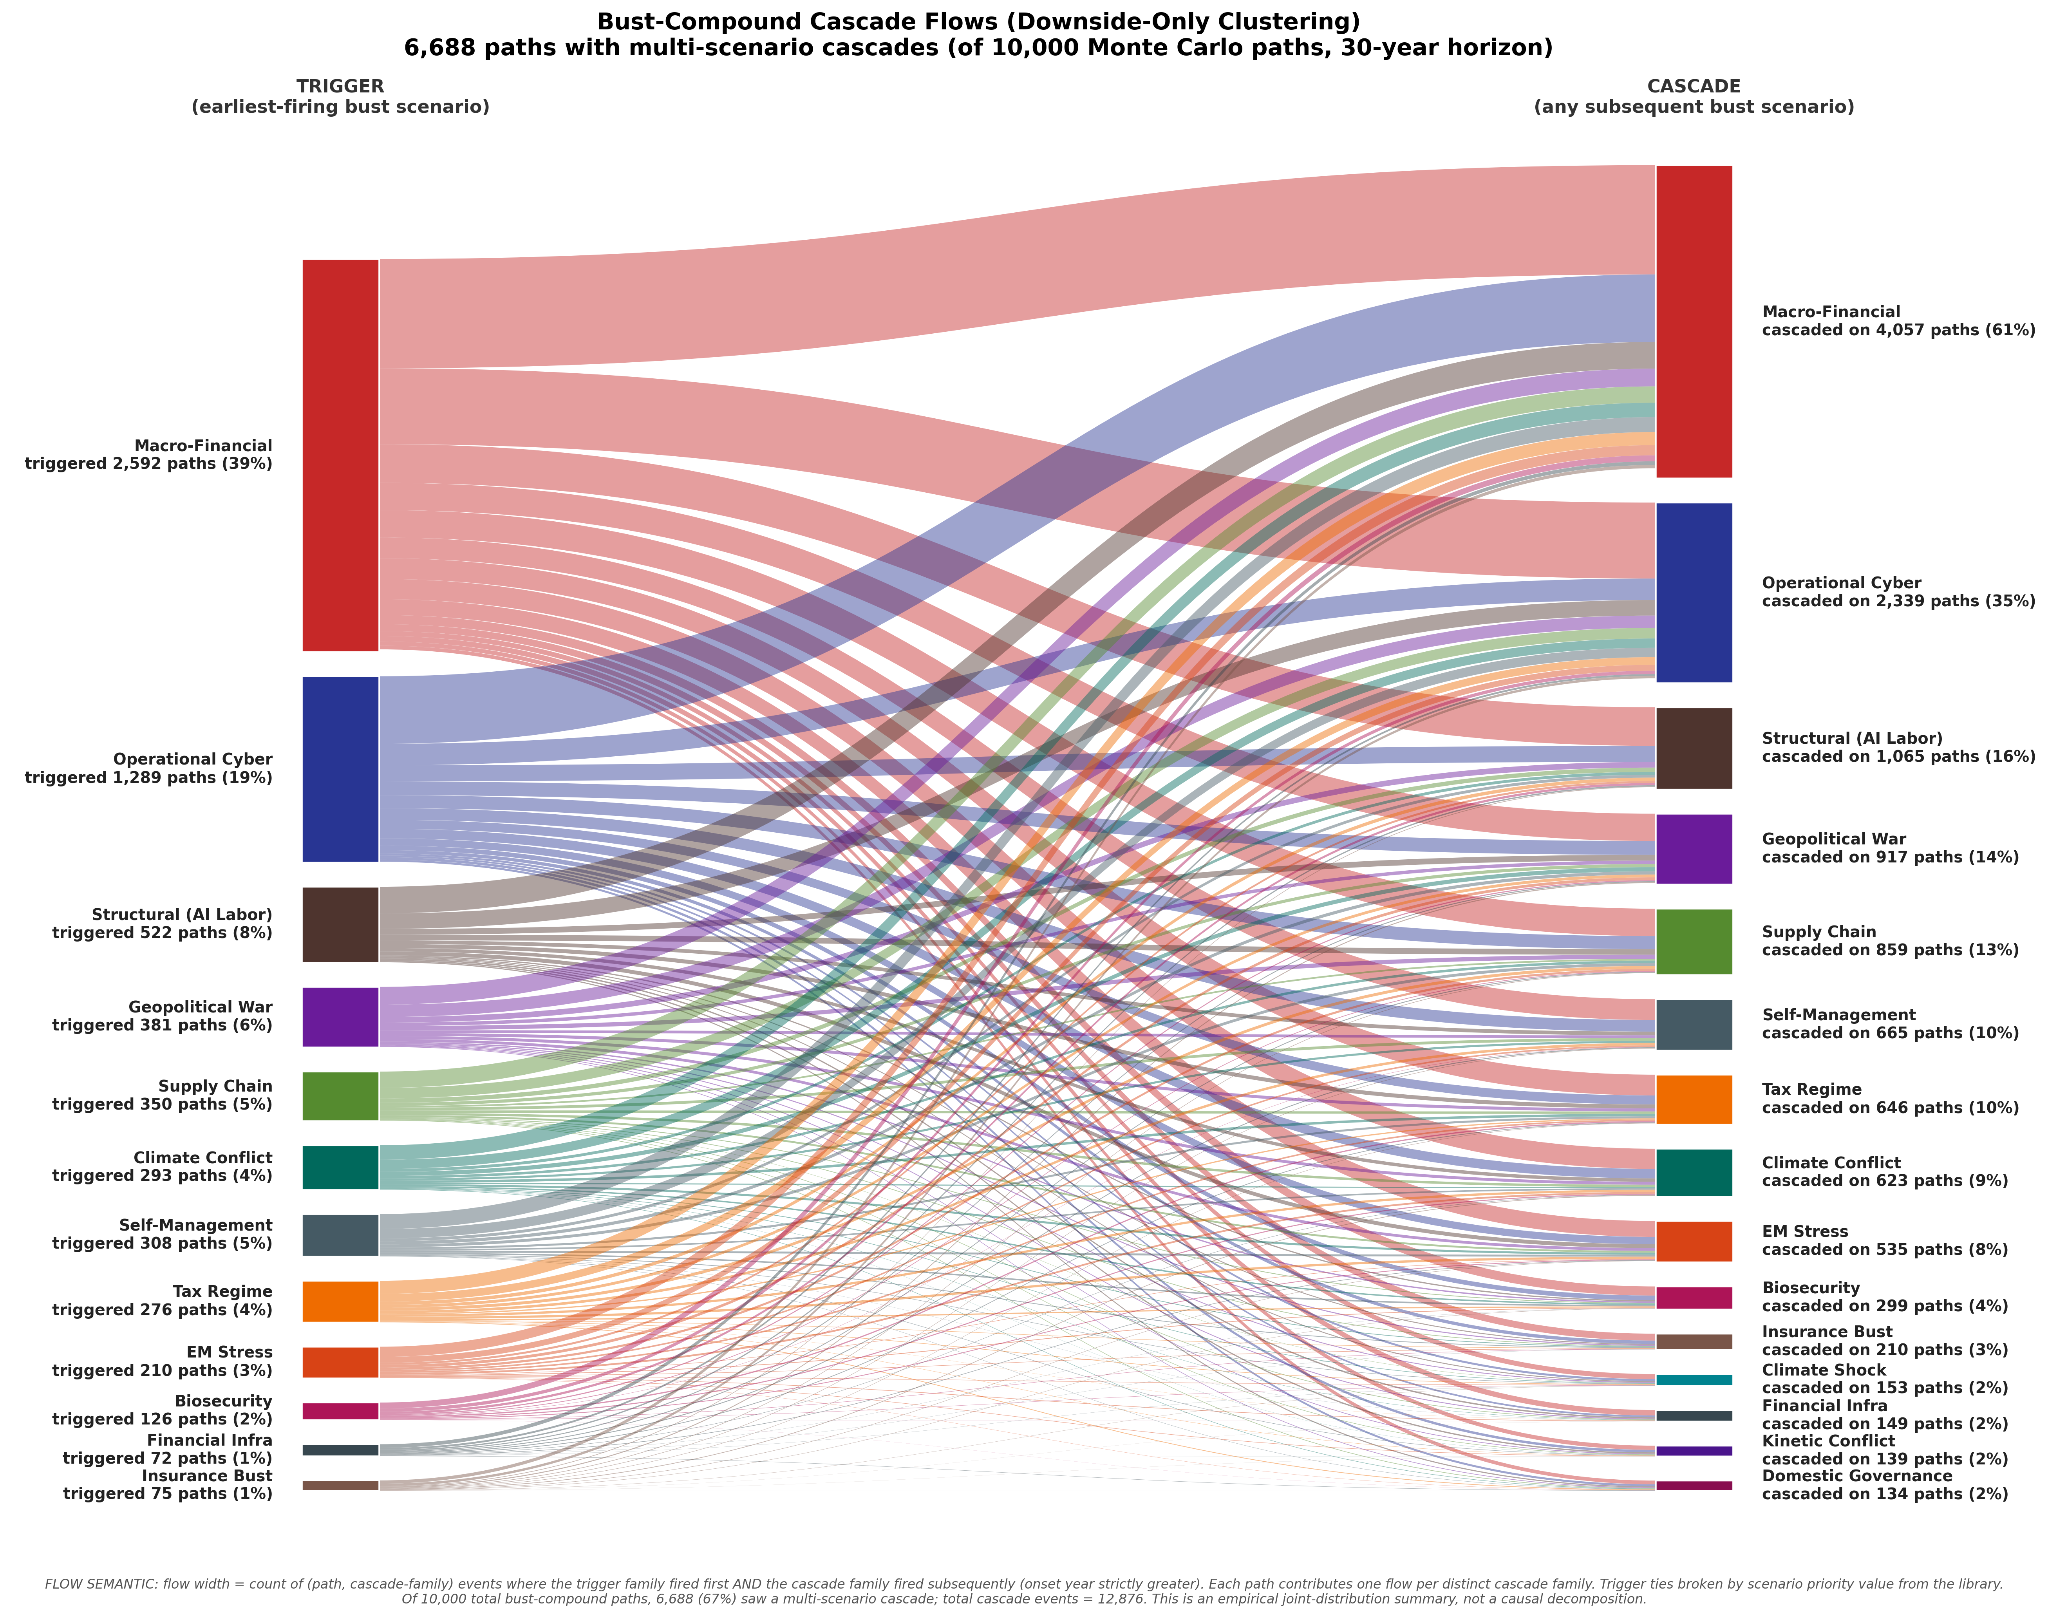
A structure emerges that isn’t subtle when you map the cascades as a flow diagram of which families trigger first, and which families follow.
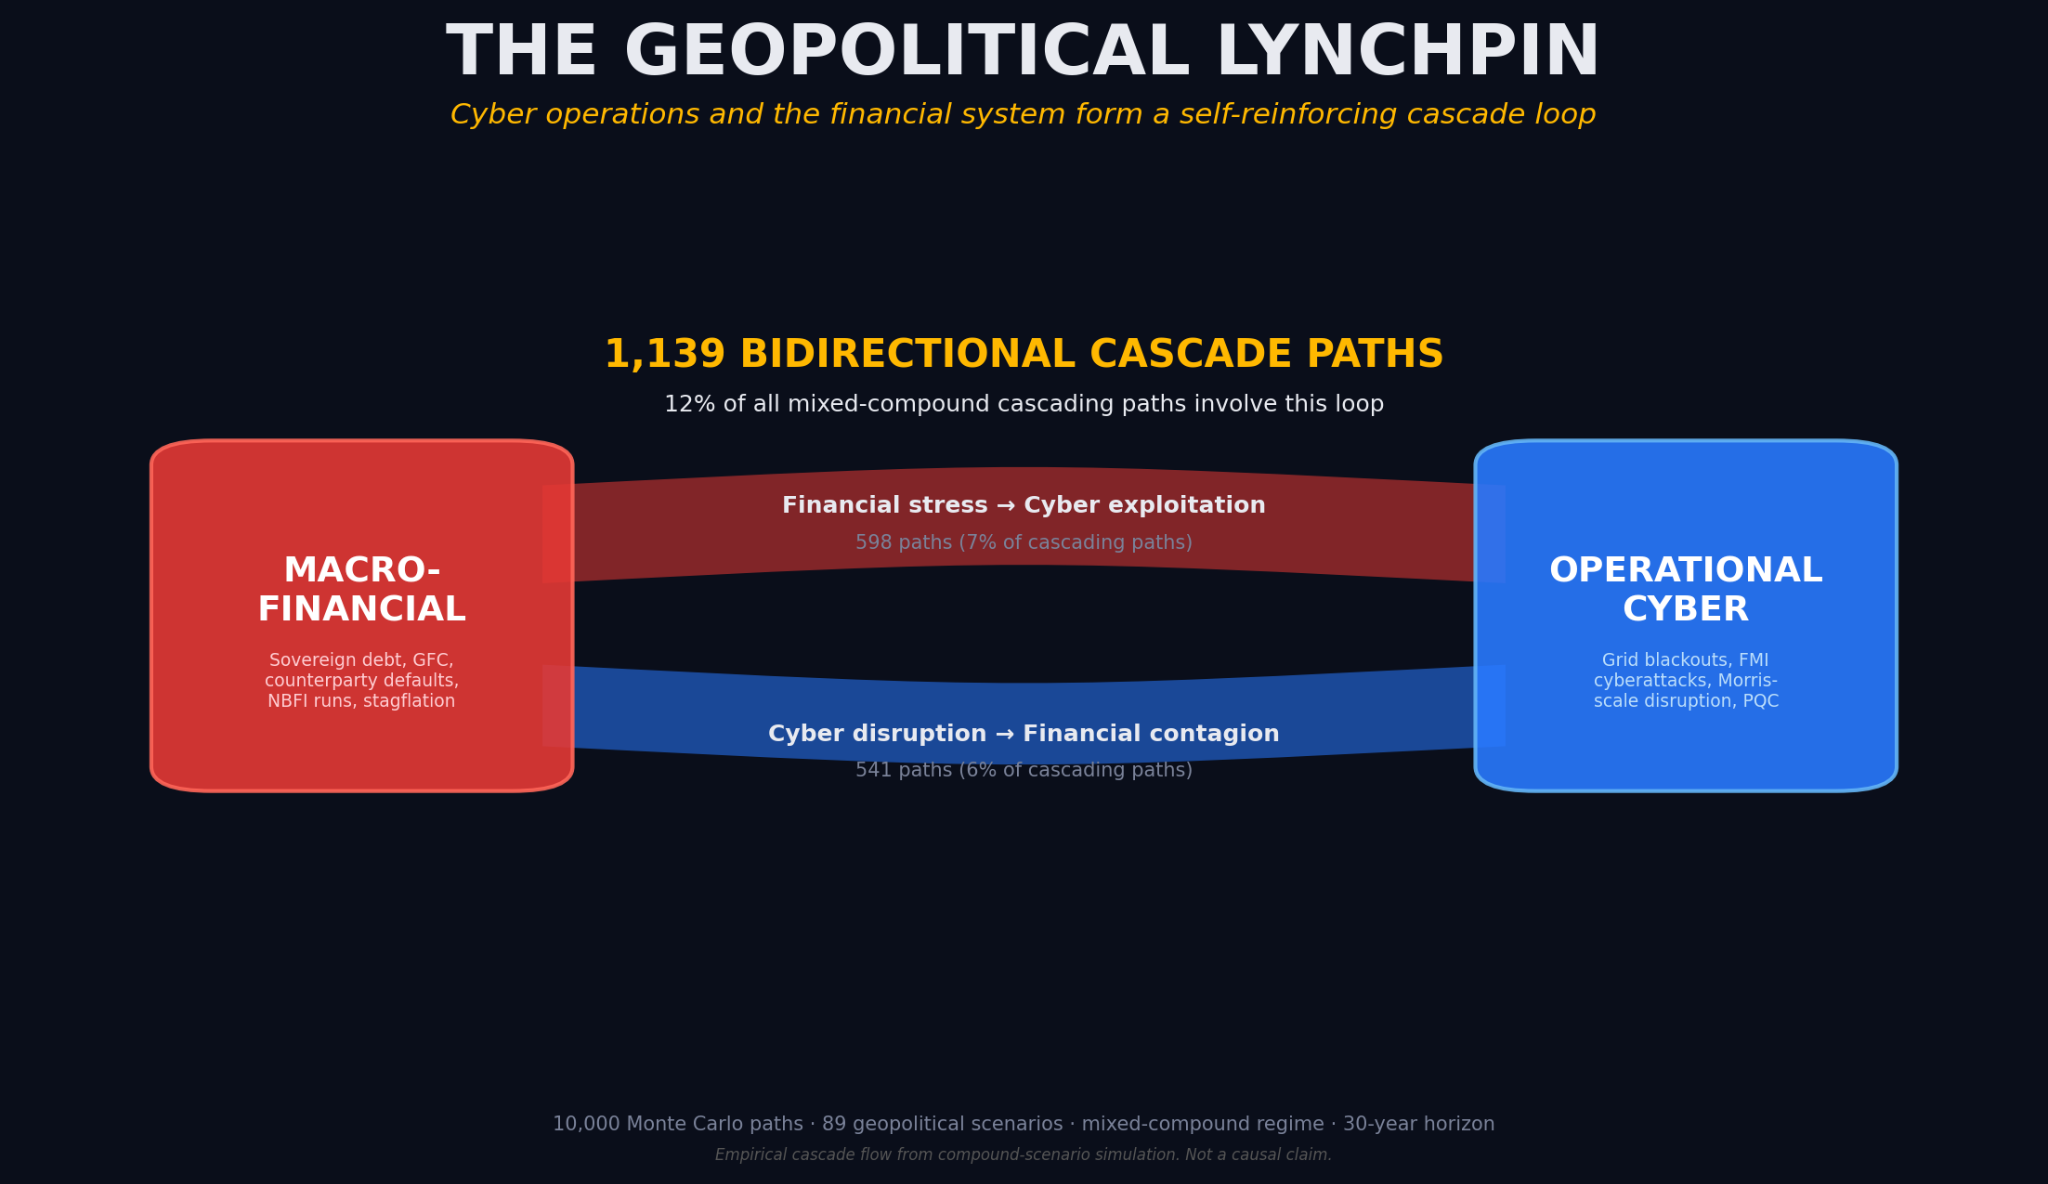
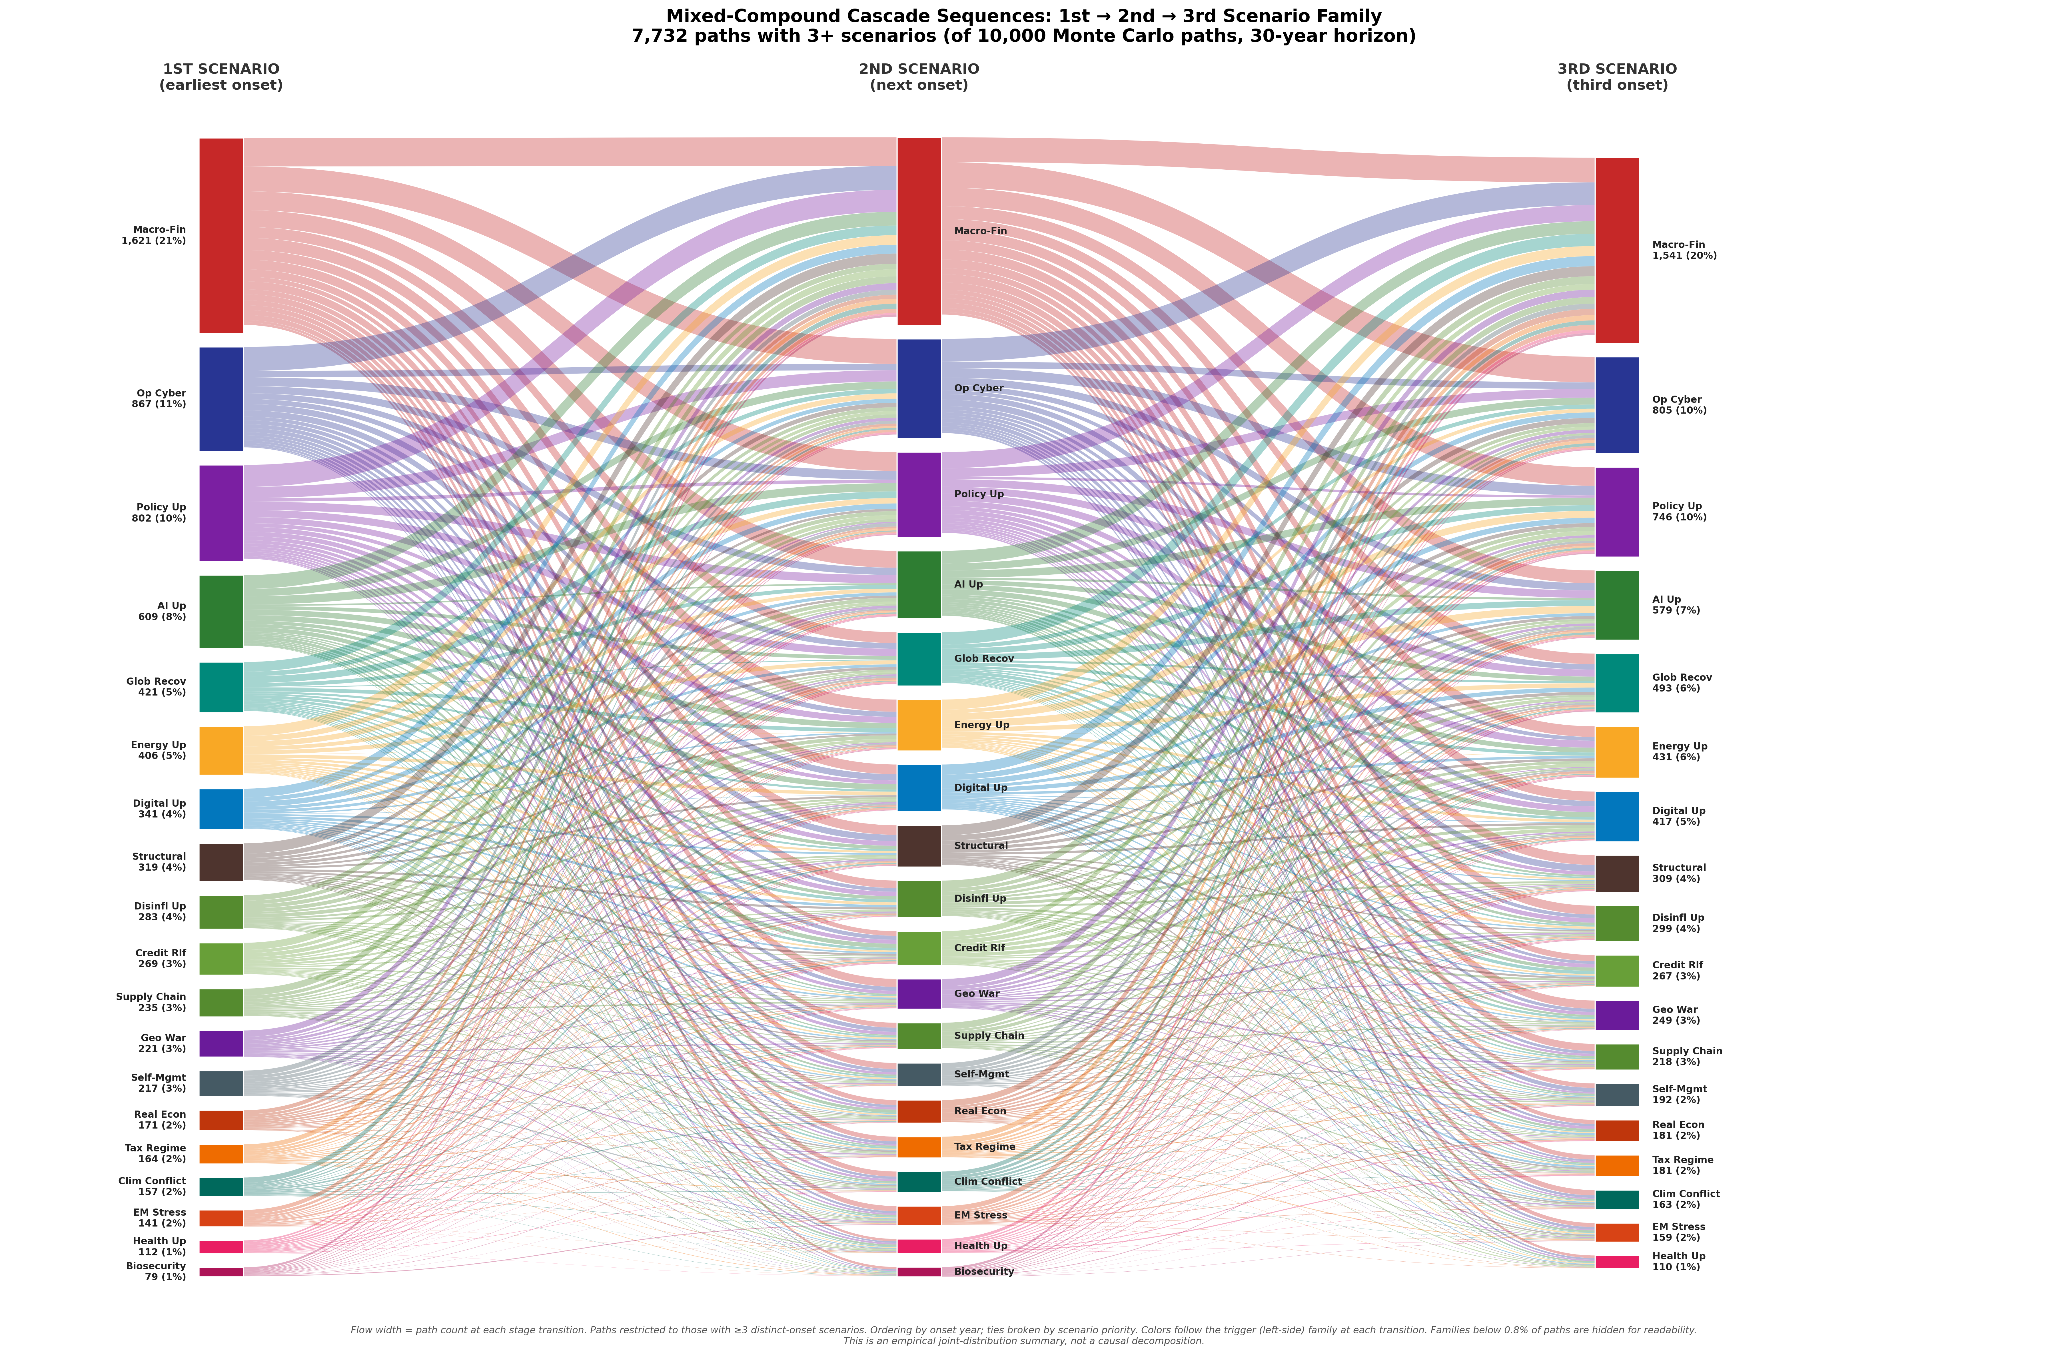
In the bust-only mode, macro-financial plumbing is the central hub. It triggers first on 76% of cascading paths and appears as a downstream consequence on 61%. The single most common three-step sequence across the mixed-mode simulation is macro-financial fires first, operational cyber fires second, macro-financial fires again. Macro-financial appears in all top-10 three-step sequences.
This is where the targeting instinct took over.
One way to think about the strategic application of cyber is as the engineered creation of black swans at the time and place required to generate asymmetric impact. You don’t need to break everything. You need to break the little thing whose failure cascades through the rest of the organizational system of dependencies. That’s the lynchpin. In every targeting exercise I ever did, the game was finding the node where leverage was highest.
The Sankey diagram was telling me that the lynchpin of the global economic system, the node whose failure produces the most cascading downstream damage, is the financial system’s plumbing itself. And the most common path to hitting it is via operational cyber.
I didn’t expect that. I wanted the model to teach me about macro economics so I could have educated conversations with finance people. The model told me something much more uncomfortable: the same reasoning that guides offensive planning, when applied to defense, points directly at the macro financial system plumbing as the thing most worth protecting. This is the thesis that has been building in the security community, that AI-era vulnerability discovery has turned latent software bugs into material financial risk, and that the institutions most exposed are the platform companies whose software sits underneath the financial plumbing. This research project didn’t set out to have anything to do with cyber, yet here we are.
If we get to choose one thing to protect, we protect the financial system plumbing. The data is unambiguous.
I’ll come back to this. But first, the portfolio question that started the whole exercise.
Three portfolios walk into a model
To evaluate common wisdom, I tested three common retirement portfolios against the scenario engine:
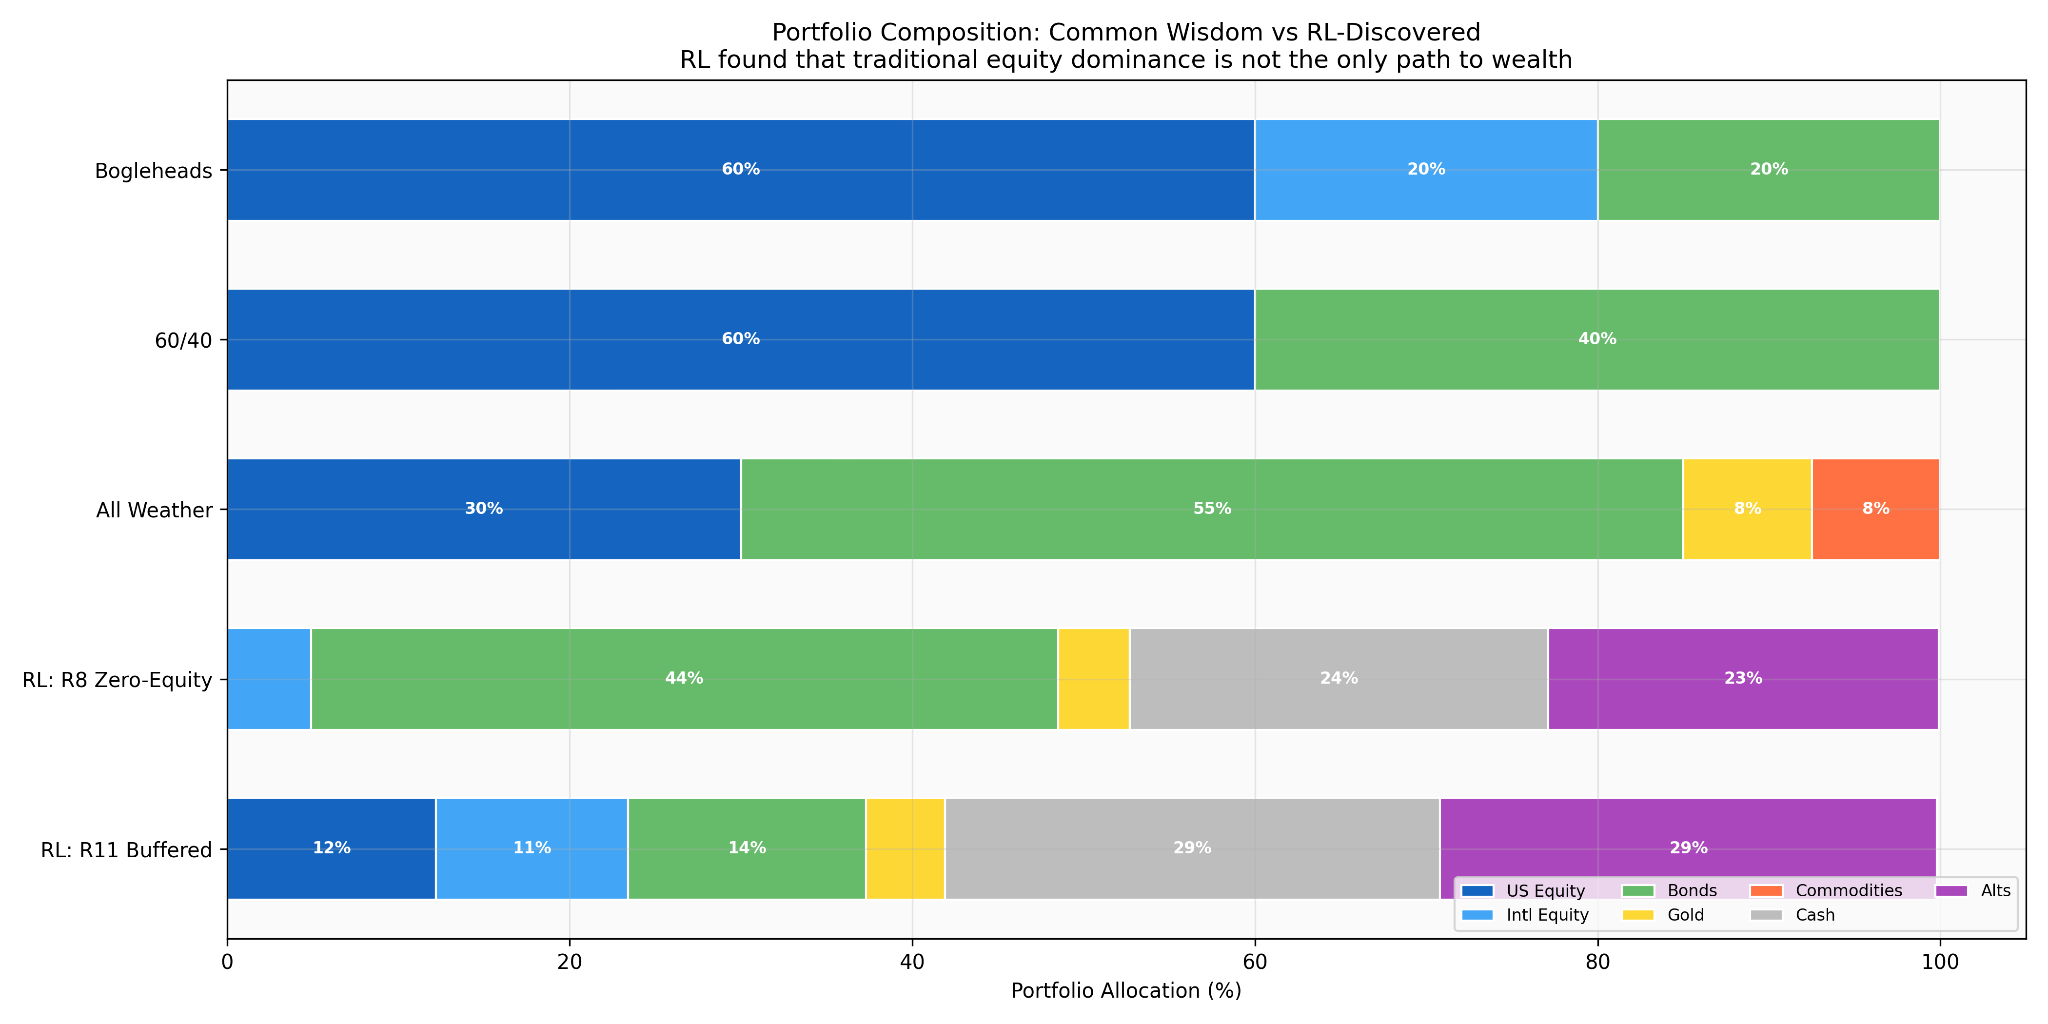
Bogleheads 3-Fund: 60% U.S. equity, 20% international equity, 20% bonds.
Classic 60/40: 60% stocks, 40% bonds.
Dalio All Weather: 30% stocks, 55% bonds, 7.5% gold, 7.5% commodities.
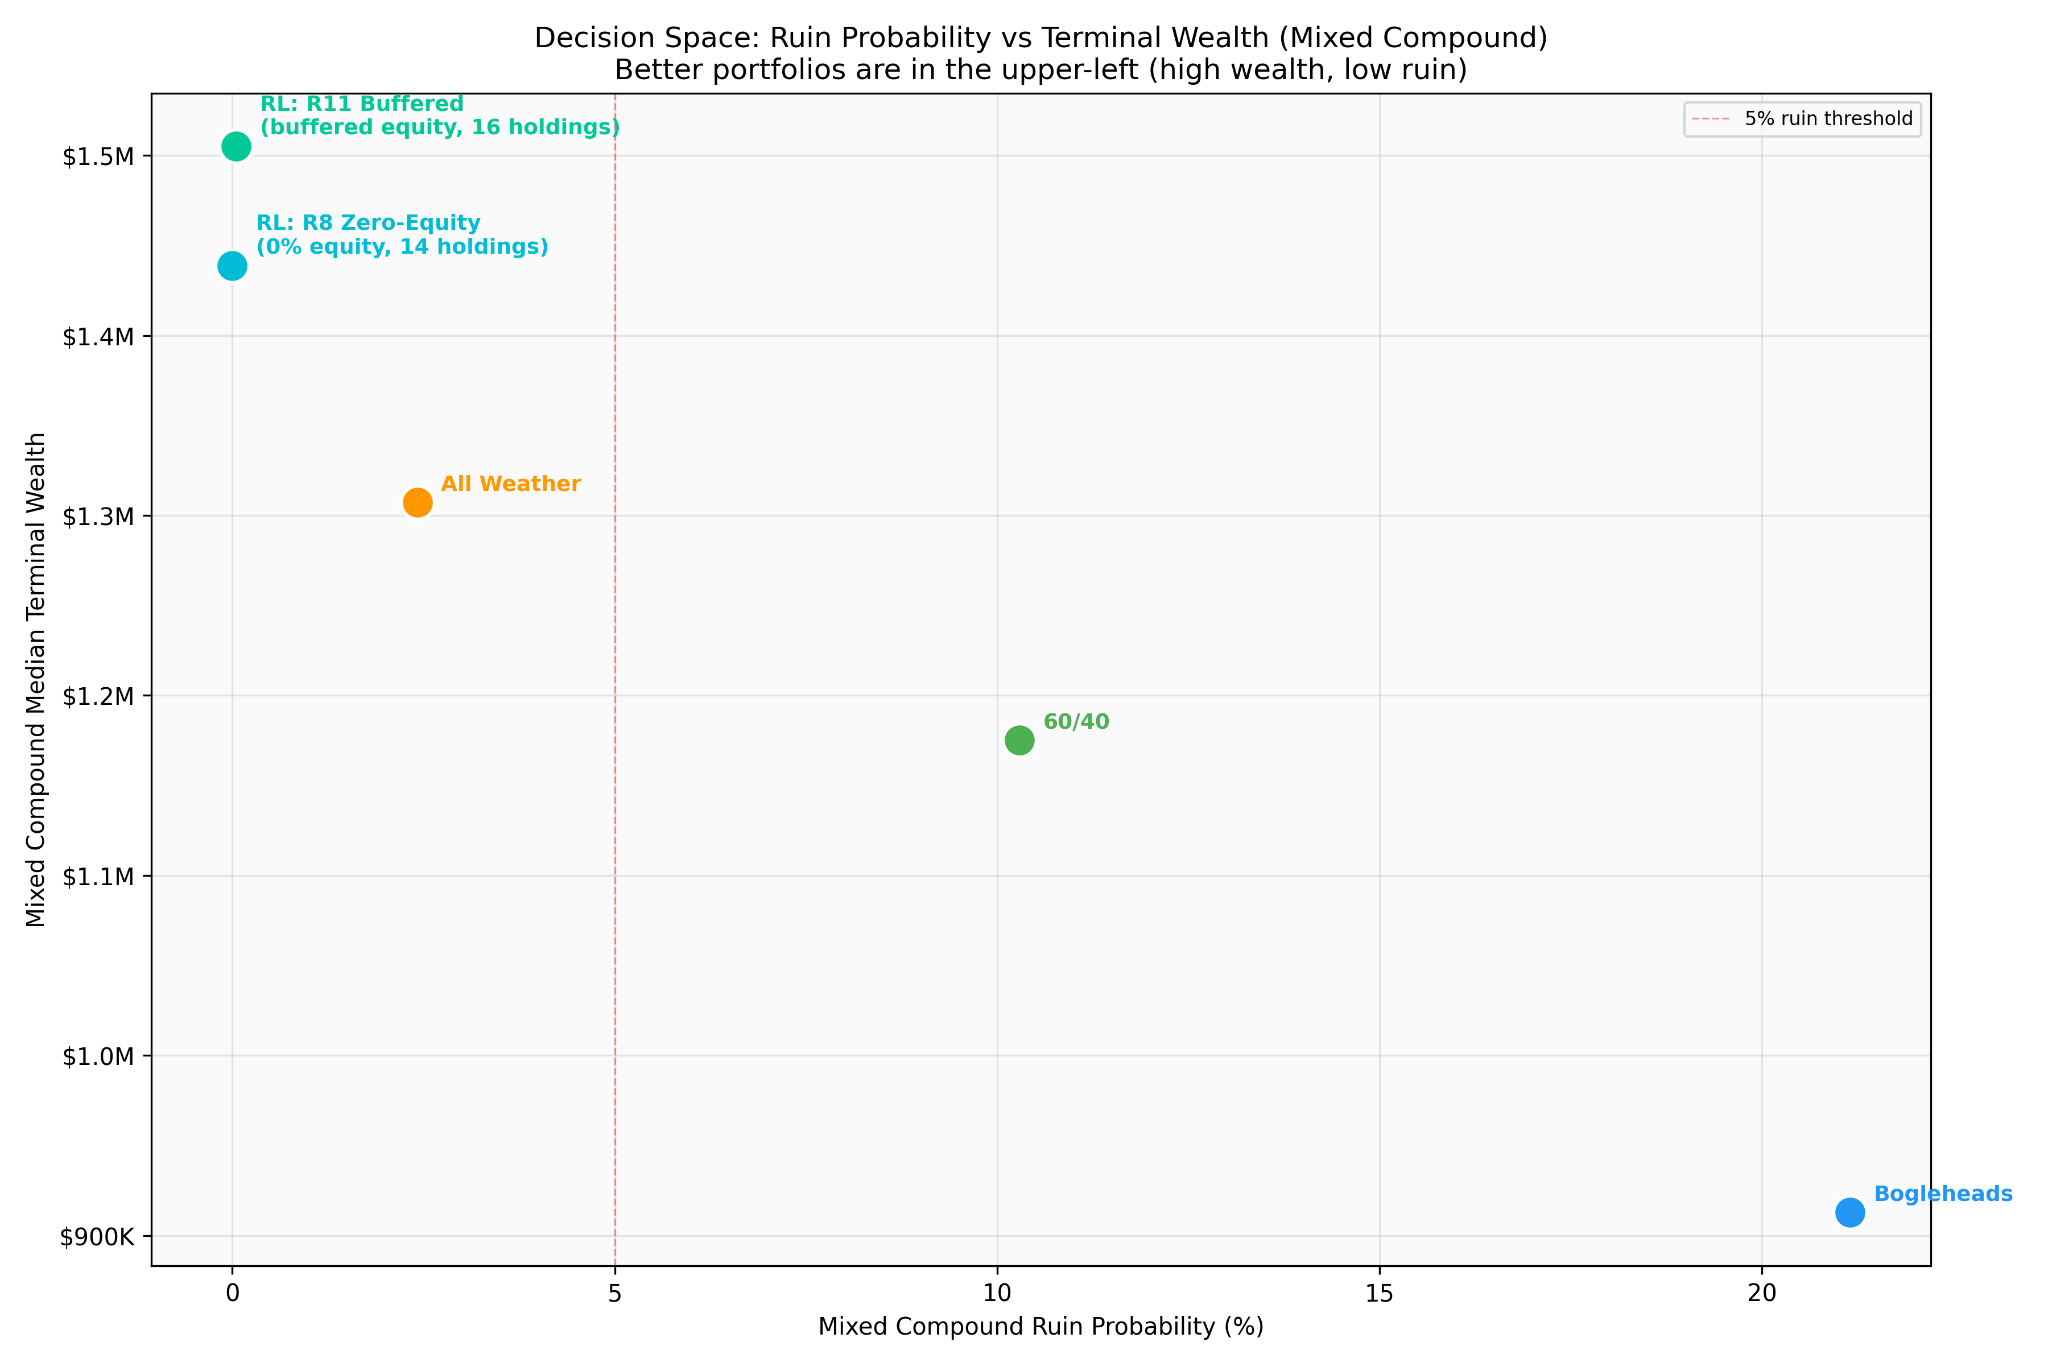
Each was simulated 10,000 times over a 30-year horizon starting from $1M with a 3% annual withdrawal. Under the structural baseline with no scenario shocks, they all look fine. Bogleheads finishes at a median $1.28M, 60/40 at $1.42M, All Weather at $1.40M. If you stop here, and most financial planning does, 60/40 looks like the best choice.
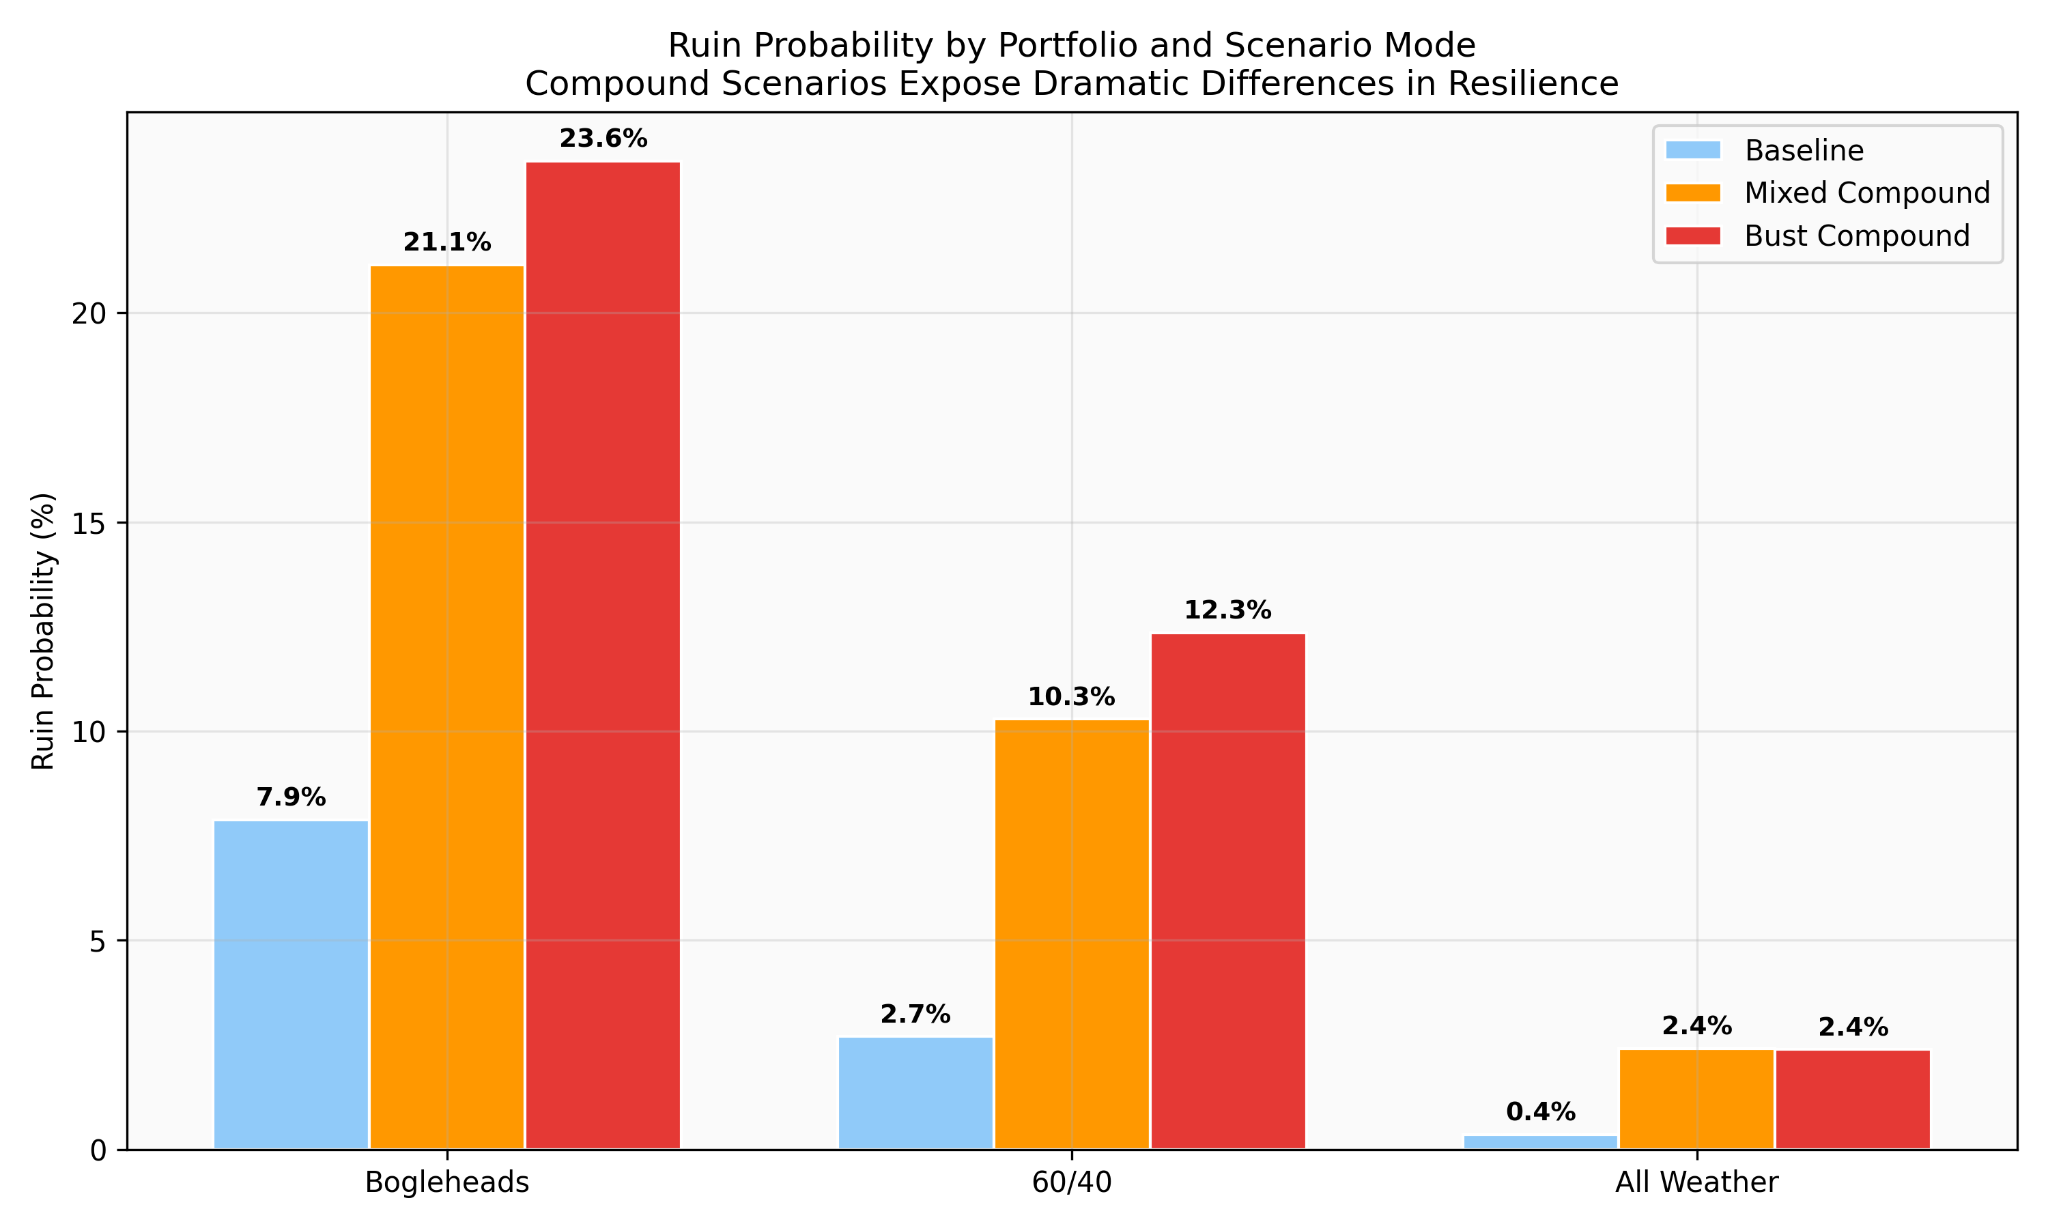
Turn on the compound scenario engine and the picture inverts.
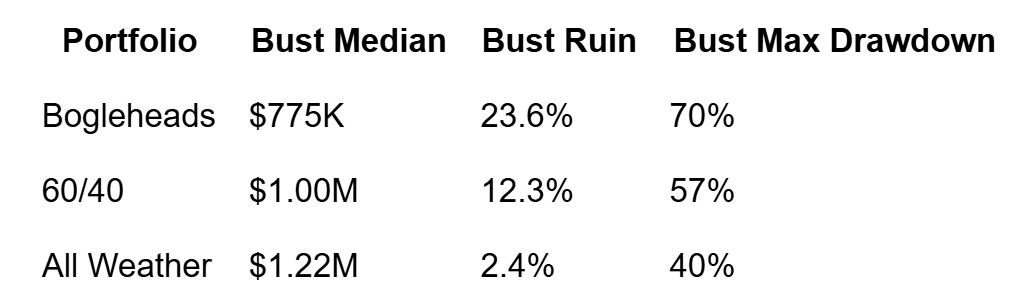
“Ruin” here means less than ten years of spending money left at the end of the horizon. Under downside-clustering conditions, the Bogleheads portfolio ends in ruin on roughly one path in four. The Classic 60/40 on roughly one in eight. Dalio’s All Weather on one in forty.
The reason is the correlation structure. Common wisdom portfolios are built on an implicit assumption that bonds diversify stocks. That assumption holds in baseline conditions. It breaks in stagflation. It breaks harder in a domestic institutional crisis, where Treasuries lose their safe-haven status. The model encodes a seven-regime correlation taxonomy, and in three of the seven regimes (stagflation, USD erosion, domestic crisis) the bond diversification assumption either weakens or inverts. The common-wisdom portfolios were never designed for those regimes because, until recently, nobody thought we’d see them.
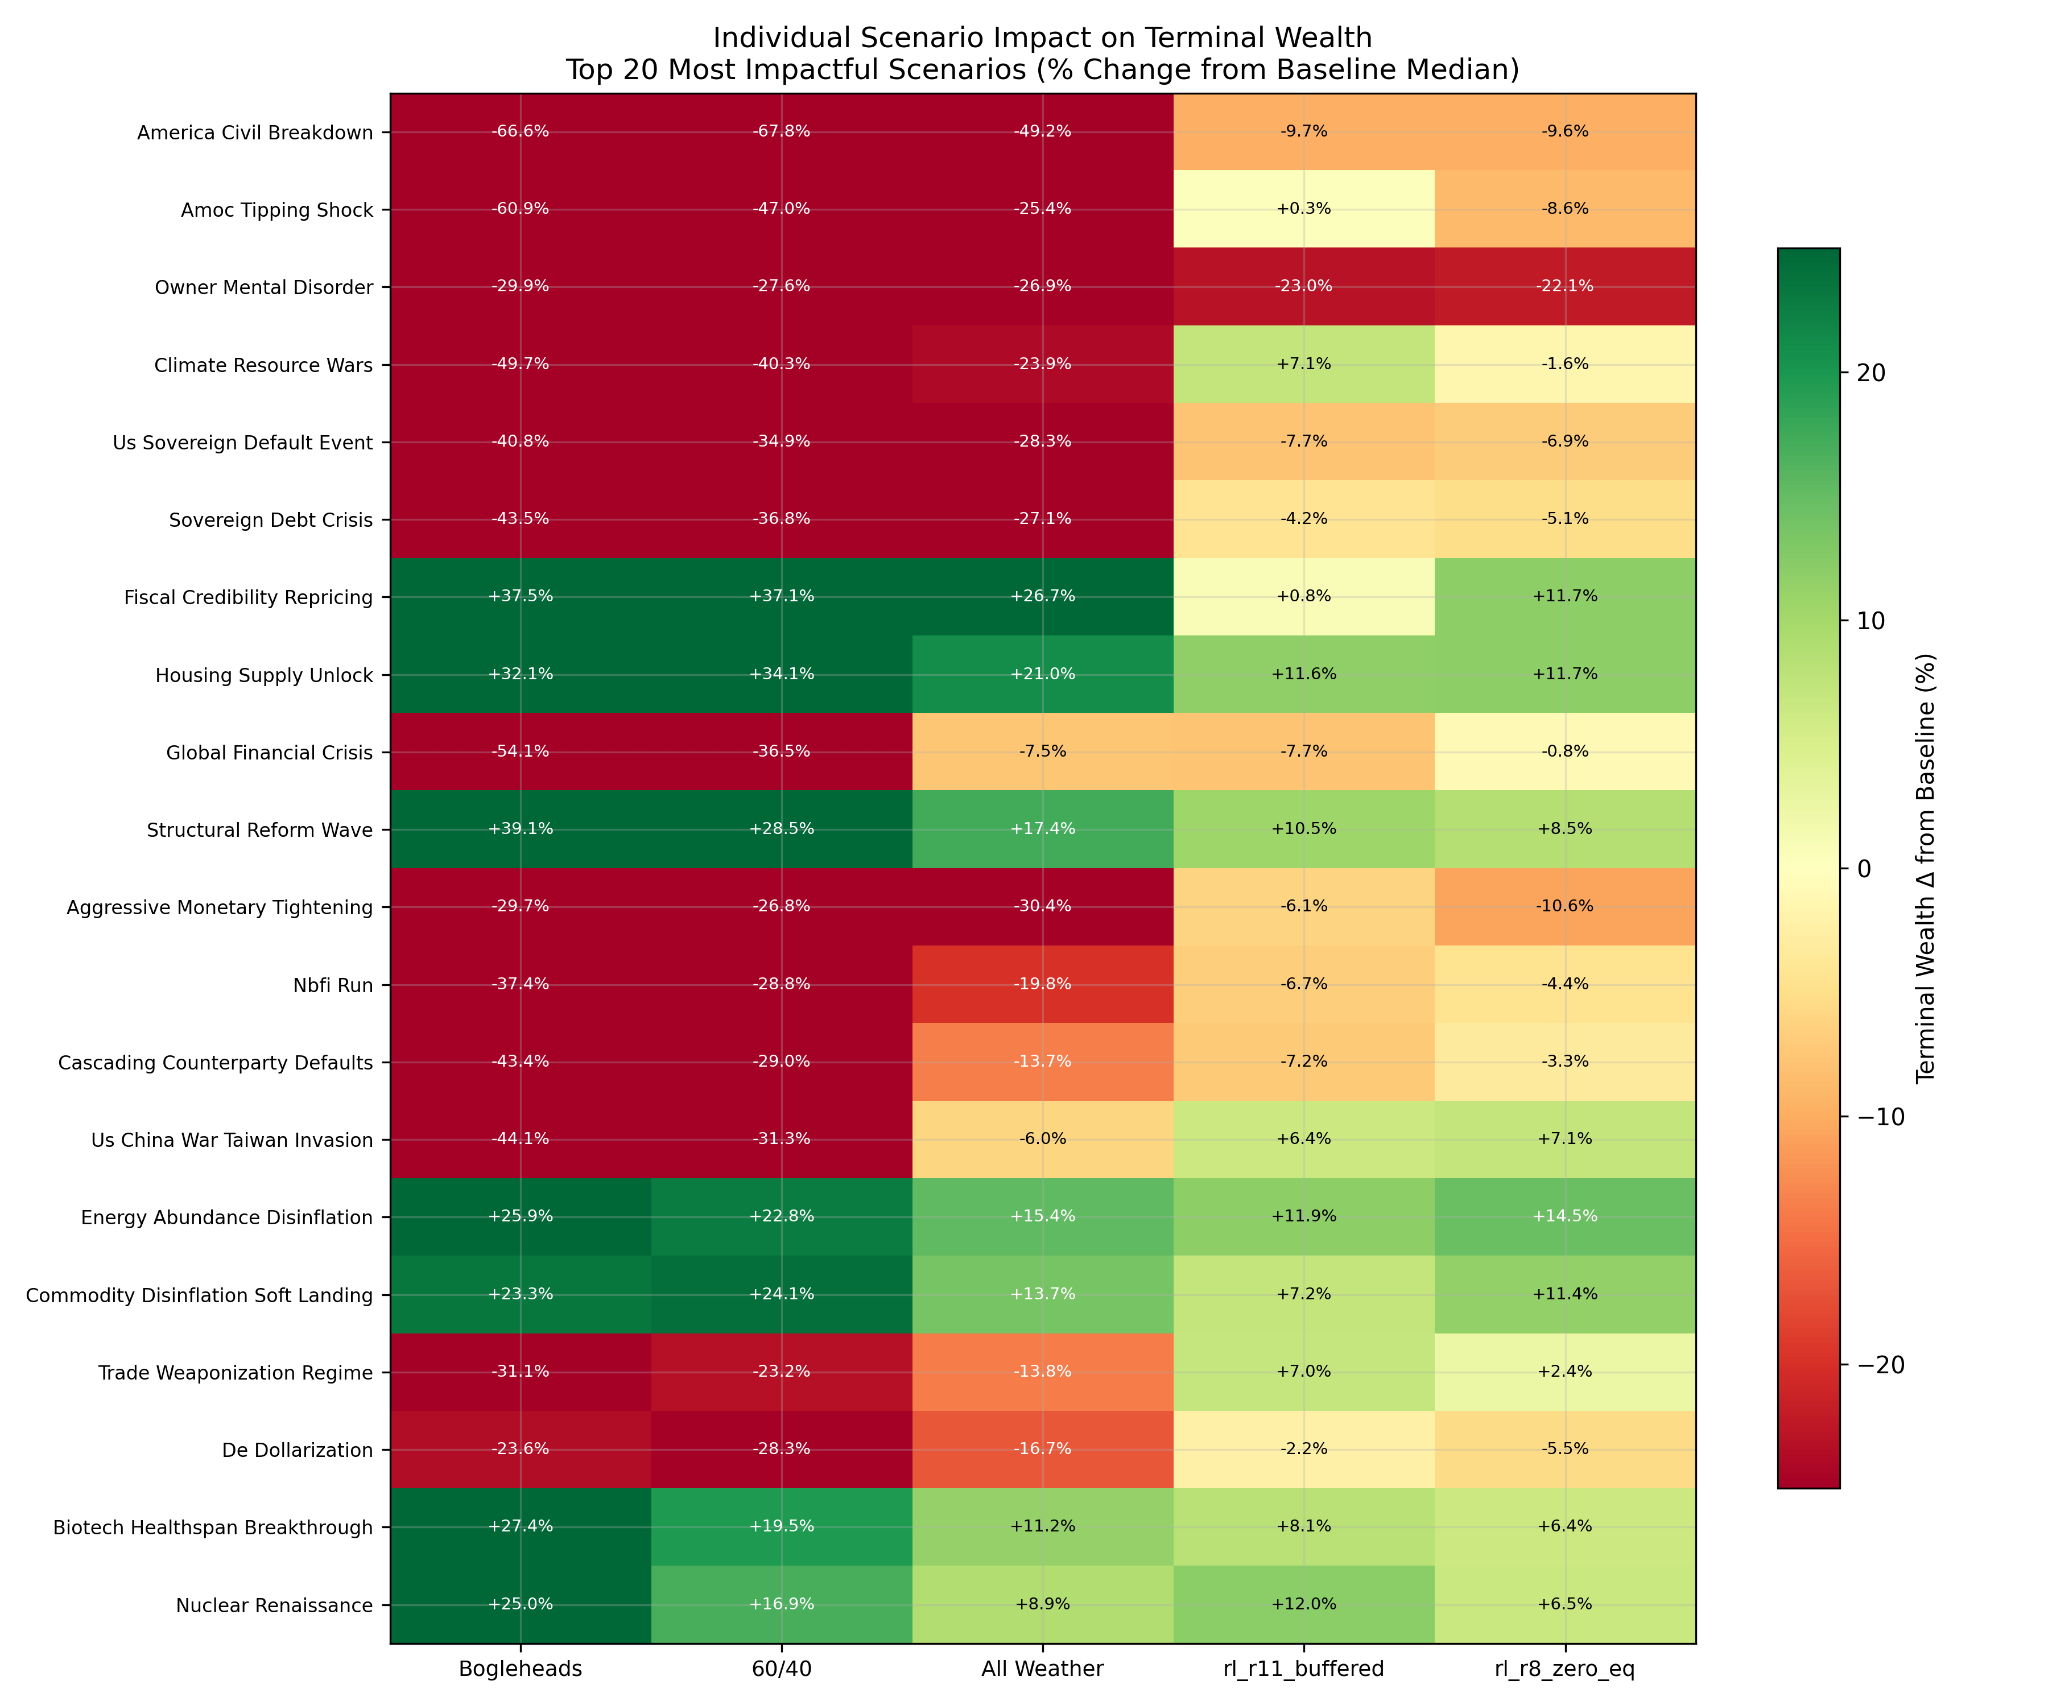
The worst individual scenarios for all three portfolios are geopolitical and institutional: civil breakdown in America (a specific institutional-failure scenario drawn from RAND and CSIS modeling, not a partisan projection), abrupt AMOC climate tipping, global financial crisis, and U.S. sovereign default. The first two produce 60%+ drawdowns in Bogleheads. All Weather takes them at roughly half the magnitude.
Nothing in this post is financial advice. Specific allocations, ruin probabilities, and fund categories are outputs of a personal research project, not recommendations. Go do your own analysis.
What the machine found
The model told me common wisdom was fragile. The natural next question was whether a portfolio designed for this future, rather than inherited from the past, would look different.
I ran a reinforcement learning (RL) search. The RL agent starts with random allocations, measures each against the compound-scenario engine using a simplified reward function, and evolves toward configurations that survive better. Eleven rounds of evolution, roughly 55 million candidate allocations evaluated.
Plenty of candidates scored well in simulation. But simulation isn’t truth, and academic asset-class categories don’t map cleanly onto purchasable instruments. So I ran a separate validation project with three independent lenses on every top candidate: factor decomposition (does the exposure profile match what the simulation assumed?), historical replay (how did it actually perform across ten real crisis windows from the 2008 GFC through March 2026?), and a per-instrument deep-dive on how faithfully each holding matches the simulation’s model of it.
Only two portfolios survived all three lenses without critical failures. I’m redacting the specific holdings.
Zero-Equity holds 14 instruments with no traditional equity at all: roughly 24% cash equivalents (T-Bills), 38% multi-sleeve bonds (investment grade, municipal, TIPS), 16% managed futures, and the balance in gold, infrastructure, and tactical alternatives. Bust-compound ruin: under 0.1%. Max drawdown: 17%. Bust-compound median terminal: $1.39M.
Buffered holds 16 instruments with ~13% structured equity via defined-outcome products that cap annual upside but mechanically absorb the first slice of downside. Higher managed futures (24% vs 16%). Bust-compound ruin: 0.1%. Max drawdown: 26%. Bust-compound median terminal: $1.38M.
Both achieve effectively zero ruin probability and bust-compound medians 78–80% higher than Bogleheads. The choice between them is a policy preference: lower drawdown vs slightly higher upside capture.
Earlier rounds produced other candidates that looked excellent in simulation but failed validation. A “Hardened” variant with 43% T-Bills and a rate-hedge sleeve scored well in the engine but relied on theoretical behaviors that the fund managers could not execute in the real world. The lesson: any single model deserves skepticism, and the difference between a good simulation score and a defensible portfolio is independent validation against reality. A good score in a model you built yourself is not the same as a defensible portfolio. Out-of-sample historical replay is the discipline that catches overfitting.
Back to the cyber part
I told you I’d come back to it.
The macro model was a personal project. I built it to answer a personal question using hard data sourced from academic literature. It answered that question with common wisdom is fragile, and the historical baseline is load-bearing on conditions that are eroding. But it also, as a side effect, handed me a diagram that reframes how I think about systemic geopolitical and strategic cyber risk.
The Sankey showed that macro-financial is the hub of the global cascade network. It showed that operational cyber is the most common bridge into a macro-financial cascade. And it showed that the dominant three-step sequence across the entire simulation is macro → cyber → macro. Read that the other way around: a cyber attack on the financial system plumbing is how you trigger a cascading failure in the world economy. Not metaphorically. As an empirical output of a simulation calibrated against the institutional literature.
This is not a new thought in the abstract. FSB, BIS, and the ECB have all published on systemic cyber risk. But there’s a difference between “experts worry about it” and “a general-purpose macro stress model, not designed to study cyber risk, independently converges on cyber attacks against financial infrastructure as the highest-leverage cascade path.” The first is policy discussion. The second is structural.
It’s also the reason Anthropic’s Project Glasswing matters more than I initially framed it. Last week I argued that the collapse in cost of cyber vulnerability discovery, driven by frontier AI models, has elevated latent software bugs from engineering debt to material business risk for the platform companies. I made an argument about risk pricing. This macro model tells me I was understating the case. The vulnerabilities aren’t just material to the platform companies. They’re material to the cascade node that the data says is the lynchpin of everything else.
If we get to choose one thing to protect, we protect the financial system. And if we get to choose one way to protect it, we start with the software it runs on.
What this means
I am not trying to predict the market. I’m trying to understand how the structure of the world is changing, using financial markets as a well-measured surrogate for that change.
A few things the model says clearly enough that I trust them:
The historical baseline is optimistic. Structural trends alone push expected returns below historical norms before any surprise events are considered. Plans built on 10.5% equity returns are starting from a number the consensus literature no longer supports.
Compound scenarios change the answer. Individual black swans are manageable. Clustered ones, with cascading dependencies, are what break common-wisdom portfolios. The difference between the three retirement portfolios under baseline conditions is noise. Under compound-scenario conditions it’s an order of magnitude in ruin probability.
Common wisdom is built for a world we are leaving. The bond-diversifies-stocks assumption holds in four of the seven correlation regimes I modeled and breaks in the others. The portfolios built around it were designed for a world of strong institutions, stable trade, and benign geopolitics. If you believe that world is changing, the portfolios deserve stress-testing against the world you actually expect.
And the one that won’t leave me alone: the financial system is the lynchpin, cyber is the most common path to hitting it, and the same targeting instinct that finds lynchpins for offense points directly at what we most need to defend. I started this project trying to answer a financial planning question. I ended it with a pit in my stomach.
The model is wrong. All models are wrong. But this one has been useful.
Fascinating - aligns almost perfectly with the news about Anthropic’s Mythos. I imagine exorbitant amounts of money will be funneled into this sphere, especially after the meeting with top bank CEOs, Powell, Bessent, etc.
Thanks Mike! Two kinda opposite thoughts + a question:
1. We spent 40+ years financializing almost all human activity and then leveraging it to ridiculous levels. Not surprise it's the lynchpin.
2. All models are wrong, some are useful. You built it this to learn macro and it handed you back a targeting package. Not saying it is wrong (not at all in fact), but it is funny that your model definitely knows your interests/background - and maximized its efforts to get your attention.
3. Why no bitcoin in any portfolio?