
The Atlantic published The Great Chinese Oil Mystery America’s greatest rival is single-handedly averting a global energy crisis. No one knows how the country is doing it—or why. Since then, the policy sphere has been arguing about where five million barrels a day went. Let’s find it while I suppress flashbacks to almost getting run over in a deep hulled Alaskan fishing boat by a Chinese tanker accelerating before he had exited the Strait of Malacca on the way into the South China Sea.
Bottom Line Up Front
The five-million-barrel or two-million-barrel difference (depending which blog you read last) at the heart of the mystery is not there. The mystery is dispelled by correcting two mistaken numbers in the math, then calibrating the gains/losses of a production system against past years where we understand China’s oil flow. Then the crude that had to come out of storage is only about 33 million barrels total between March and June. If you like statistics, the 90% confidence interval is between 15 and 52 million barrels. That’s 0.27 million barrels a day, or three days of China’s normal imports. It easily fits inside China’s admitted underground storage caverns. There is no secret underground oil villain lair required. The mystery is 96% accounting artifacts, 4% mystery.
What China actually did was not a masterstroke. Its refiners lost money on $100 crude and stopped refining. Oil demand was already down about 10 percent year on year, and two decades of building oil reserves meant a modest release of strategic reserves covered the rest. The interesting question is not how Beijing hid 750 million barrels. It is what China demonstrates when it can go quiet for five months without visible strain and the west can’t figure out how or why.
The research data was current as of 30 July 2026.
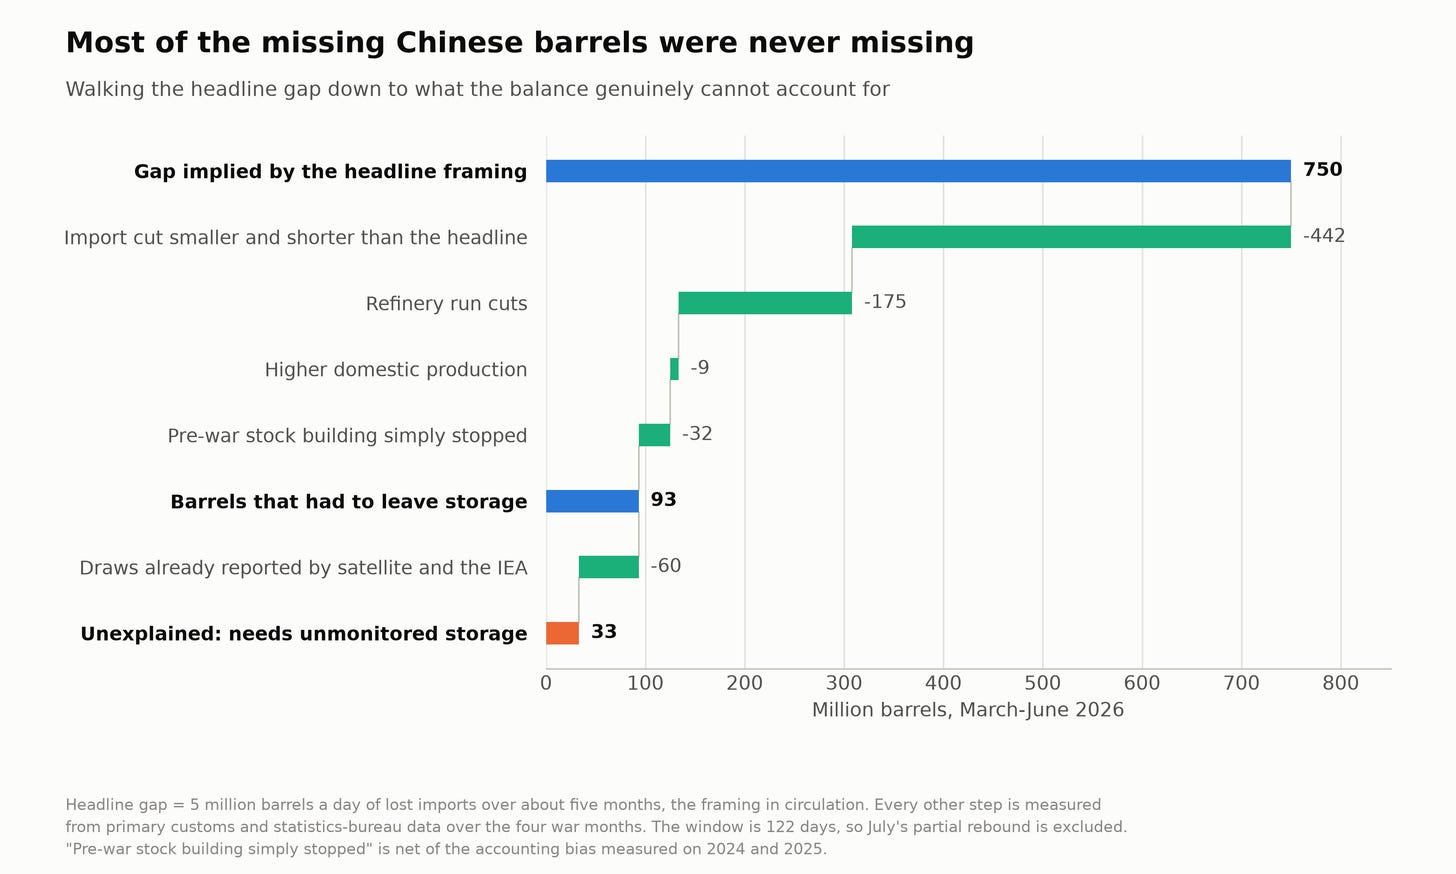
Here is the walk through the oil without too much accounting talk.
The two-million-barrel delta doesn’t math
The Atlantic published its version of the puzzle on Wednesday and landed on secret oil reserves as the only explanation left, even as the analyst voicing that conclusion cautioned, “We have almost no evidence of it.” The same week, ChinaTalk ran an episode with Arnab Datta and Rory Johnston that got further on the crude ledger than anyone else had, and then stopped at an honest wall. Imports fell about five million barrels a day, refining runs fell about three, and that, in Johnston’s words, “leaves a two-million-barrel delta in crude. Where did it go? We don’t see it coming from visible commercial tanks.” Johnston drew the line himself: “That’s all we know for sure. Everything else is speculation.”
The skeptics have had the better math for a while. David Fickling argued in Bloomberg Opinion on June 18 that EVs, shifting petrochemical feedstock, export cuts, and ordinary stockpile management could cover the whole drop. What nobody has published is a number with a range of the hidden barrels.
Start with an arithmetic that the podcast states but could not resolve. A 2 million barrel a day crude shortfall sustained for roughly ninety days is about 180 million barrels. China’s official strategic petroleum reserve figure is 131 million barrels across six underground caverns. Closing the gap means draining the entire official SPR and then finding at least 50 million barrels more in facilities nobody has documented. That’s the tension.
There is a simpler answer: the numbers used to calculate the 2 million barrels a day shortfall were wrong. The baseline has a transcription error, one widely quoted peak is a year out of date, and the accounting was never calibrated. Each of those is checkable, so let’s check them.
The books must balance
If you’re allergic to accounting then skip these three paragraphs. The summary is that oil is a “thing” and you need to calculate how much is moving through the pipelines and refineries, is burned to power the refineries, and how efficient refineries can produce more barrels of processed oil than they took in. If you ever want to be a CEO then stop worrying and learn to love the accounting.
China’s crude system must balance simple math: imports + domestic production = refinery runs + the net change in stocks + a bias we’ll calibrate in a moment. Oil is a real commodity, barrels do not vanish or appear despite what futures contracts may say. Every term but the bias is directly observable somewhere: monthly import tonnages published by the General Administration of Customs (GACC, 海关总署), production and refinery throughput from the National Bureau of Statistics (NBS, 国家统计局), and residual movements around the system. They’re all checked against Kpler’s satellite tank monitoring and the IEA’s Oil Market Report published at the time. China releases the numbers in tonnes and our math will use 7.3 barrels per tonne. For my fellow Americans, a tonne is the metric unit for 1,000kg.
We need to calibrate the bias to make this more than a back-of-the-envelope calculation. The bias is everything the simple math loses track of: unprocessed crude burned directly in power and industrial plants, gains and losses from refinery processing, and the oil moving through the pipelines and sitting at the bottom of tanks. Because the math simplifies a real system the imports + production will always exceed reported refinery runs. The excess looks like adding to the strategic petroleum reserves where it is just the cost of industrial production. You calculate it by running the same math on full calendar years where we know what really happened to Chinese oil. In 2024, the math implies China stockpiled 1.16 million barrels a day (mbd), but independent reporting saw only 84,000 barrels a day of buildup. Likewise the 2025 numbers indicate a 1.12 mbd surplus against a reported 0.43 mbd. The balance overstates the actual stockpiling of oil reserves by 0.69 to 1.07 mbd depending on the calibration year. For simple math we’ll call it 0.88 mbd of system bias but use the full range in our later simulations. Skip the step that approximates the reality of a physical production system and your math invents phantom barrels of oil. The more precisely you can observe the Chinese oil import and production system, the more precisely you can derive the bias. One comfort: independent estimates of the 2025 stockpile build run higher than the reported 0.43 mbd, and a bigger real build means a smaller bias and a smaller pile of hidden barrels at the end. My calibration is the conservative choice.
There is still uncertainty in all this so every number then goes into a seeded 200,000-draw Monte Carlo as a range: monthly imports, runs, production, the bias, and the reported visible stockpile draws at plus or minus 20 percent. The Monte Carlo simulation will help us understand what the uncertainty does to the numbers. For the record, I trust the customs and NBS tonnages the most and the bias calibration the least, and I will show you exactly how much rides on that.
Two numbers the debate is getting wrong
Auditing the public record against the primary data turned up two material errors circulating, and both of them are part of the mystery oil.
The 2025 baseline. China’s actual reported 2025 crude imports were 577.73 million tonnes, not the widely printed 557.73. It is a digit transposition, and it went out on the wire and into at least three outlets that I can show you. It’s off by 20 million tonnes or one fat finger.
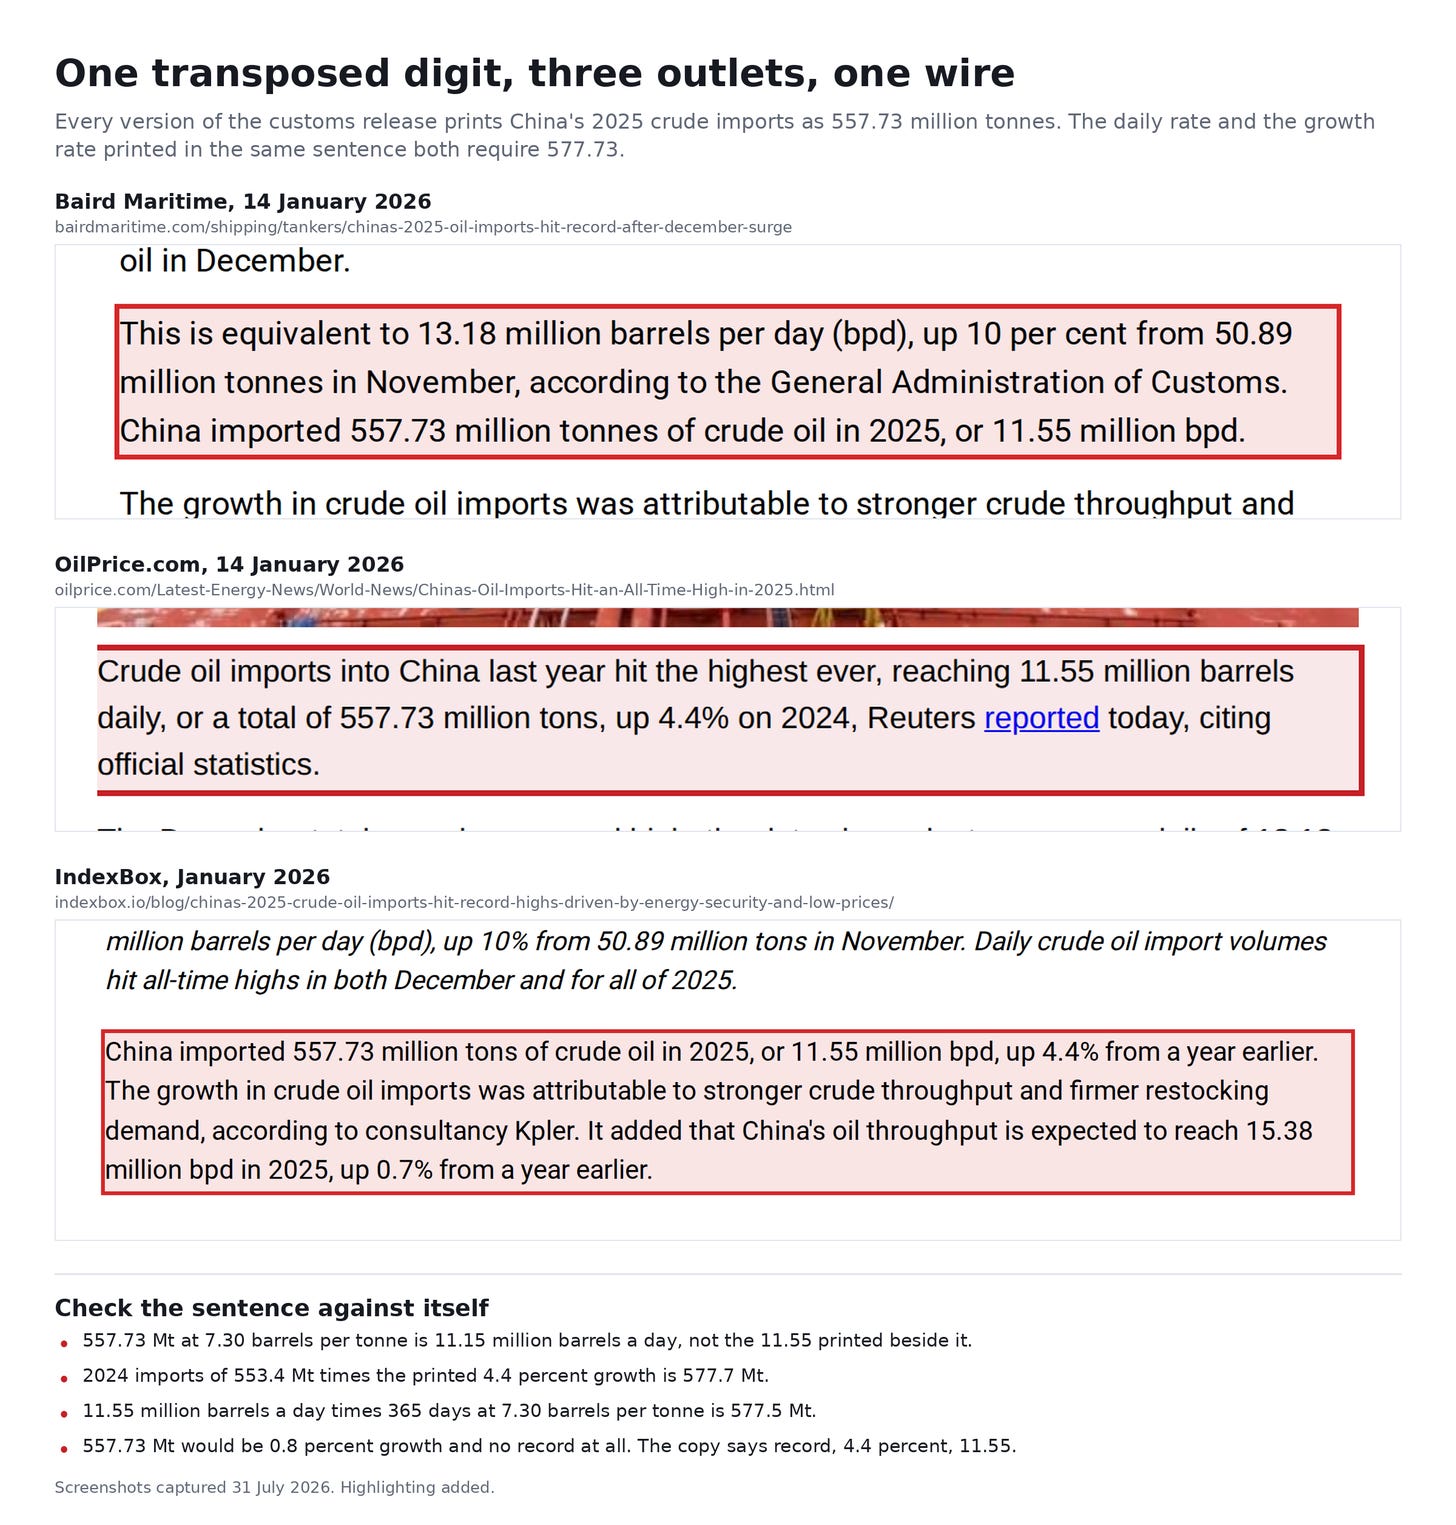
Twenty million tonnes is 146 million barrels of 2025 imports, and the baseline is what every claim about a wartime cut is measured against. Get the baseline wrong and you mis-size the cut. Worse, the baseline is what calibrates the bias, and the Monte Carlo says the baseline import figure is the third-biggest driver of the final answer.
The March peak. The other number is a 12.1 mbd Chinese import peak in March, which implies China surged buying into the war. Go looking for it and you will find it. It was published on April 15, 2025, and it describes March 2025. The details travel with it and are also 2025: imports 1.7 mbd above January and February, Iranian cargoes moving ahead of tighter US sanctions. I missed this one too on my first search through the public records.
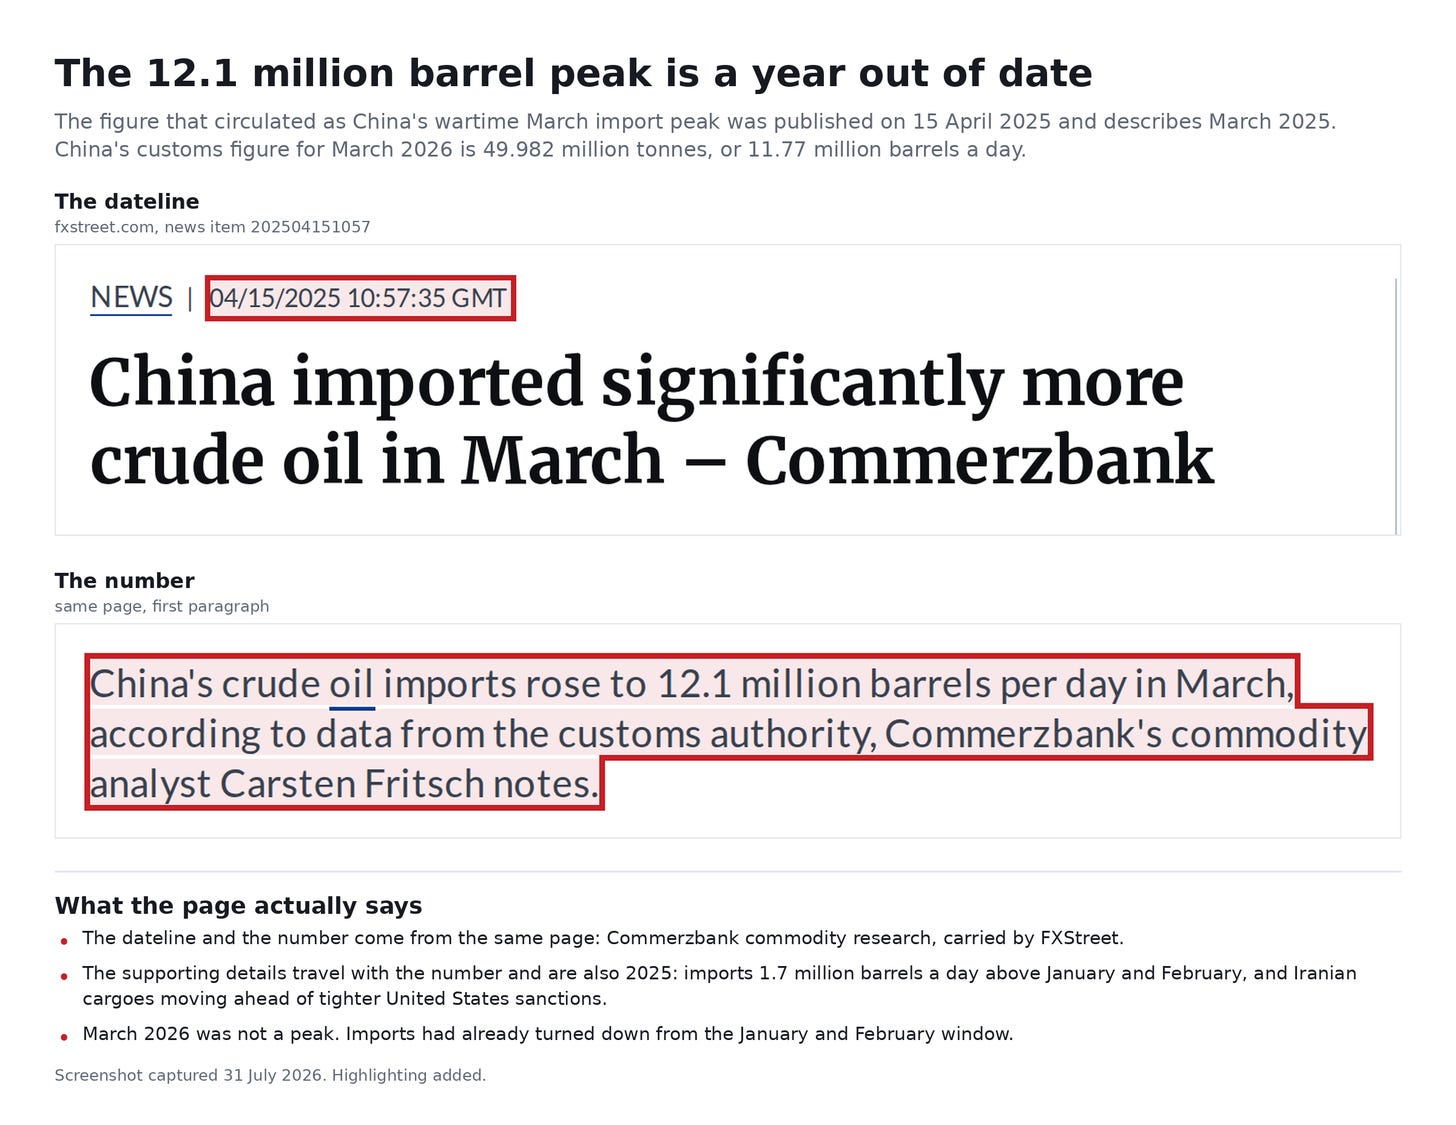
The March 2026 Chinese data shows 49.982 million tonnes, 11.77 mbd. The true peak came in the combined January-February window. Before the war. That discrepancy rewrites the entire narrative: the import surge was anticipatory stockpiling ahead of a potential war, and the market had already priced in a war premium of $11 per barrel before the kinetics happened.
The cut was later, smaller, and shorter than the headline
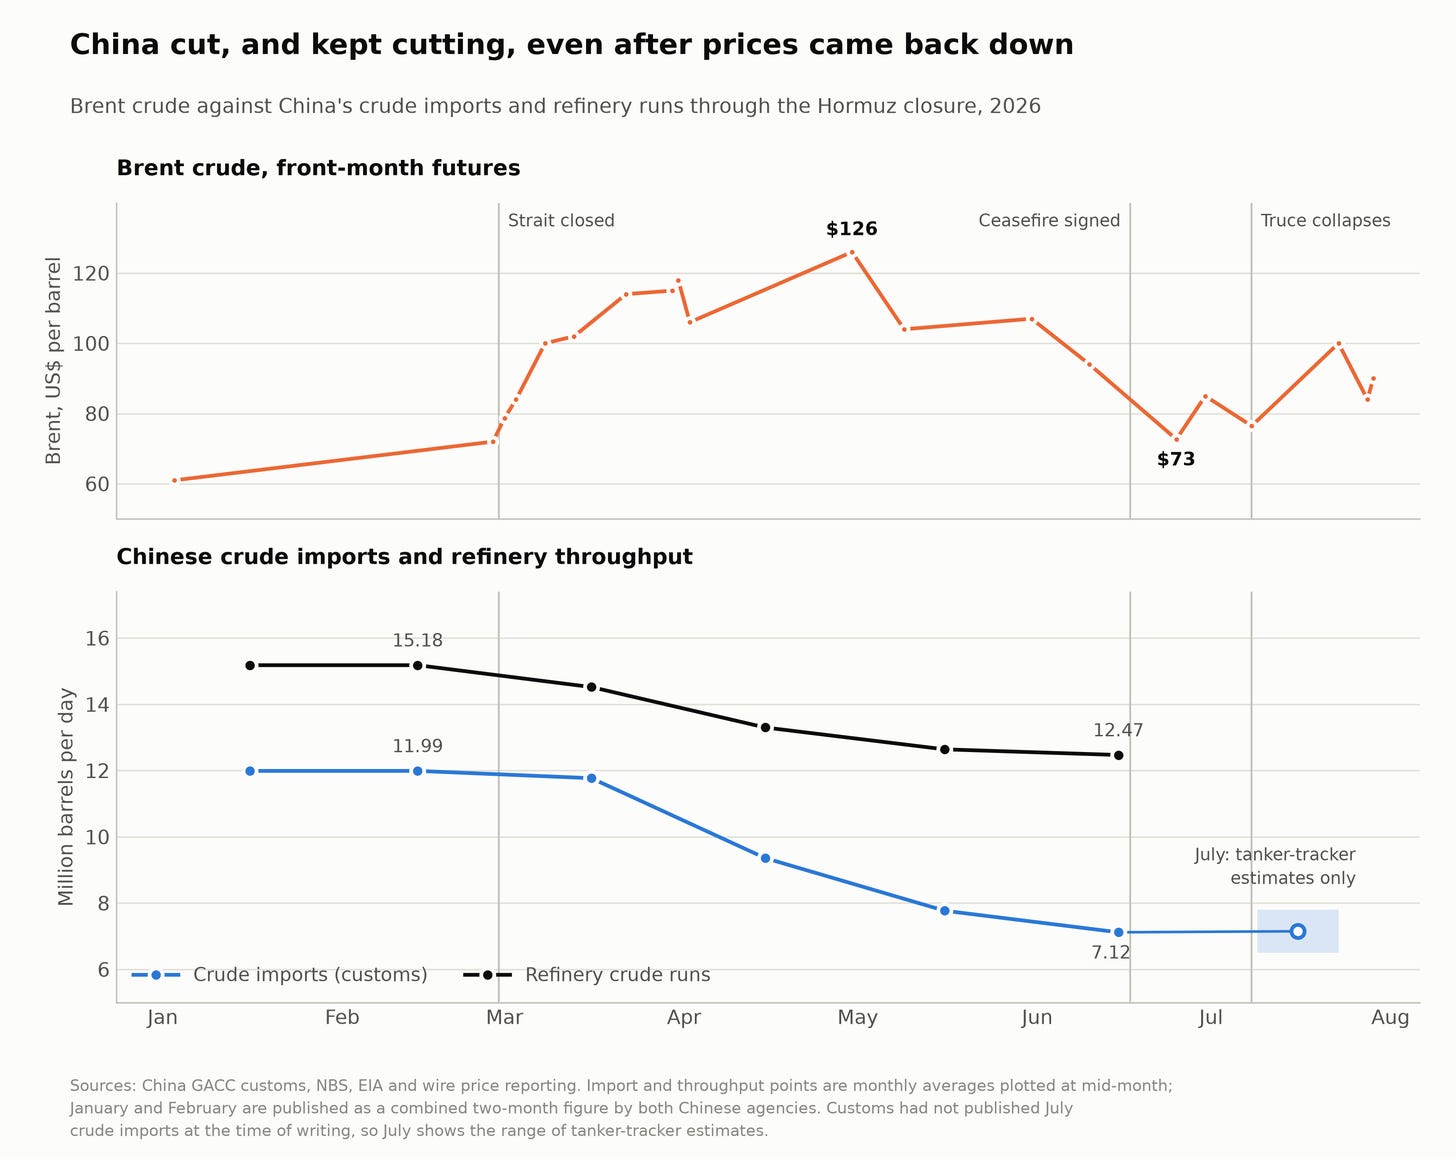
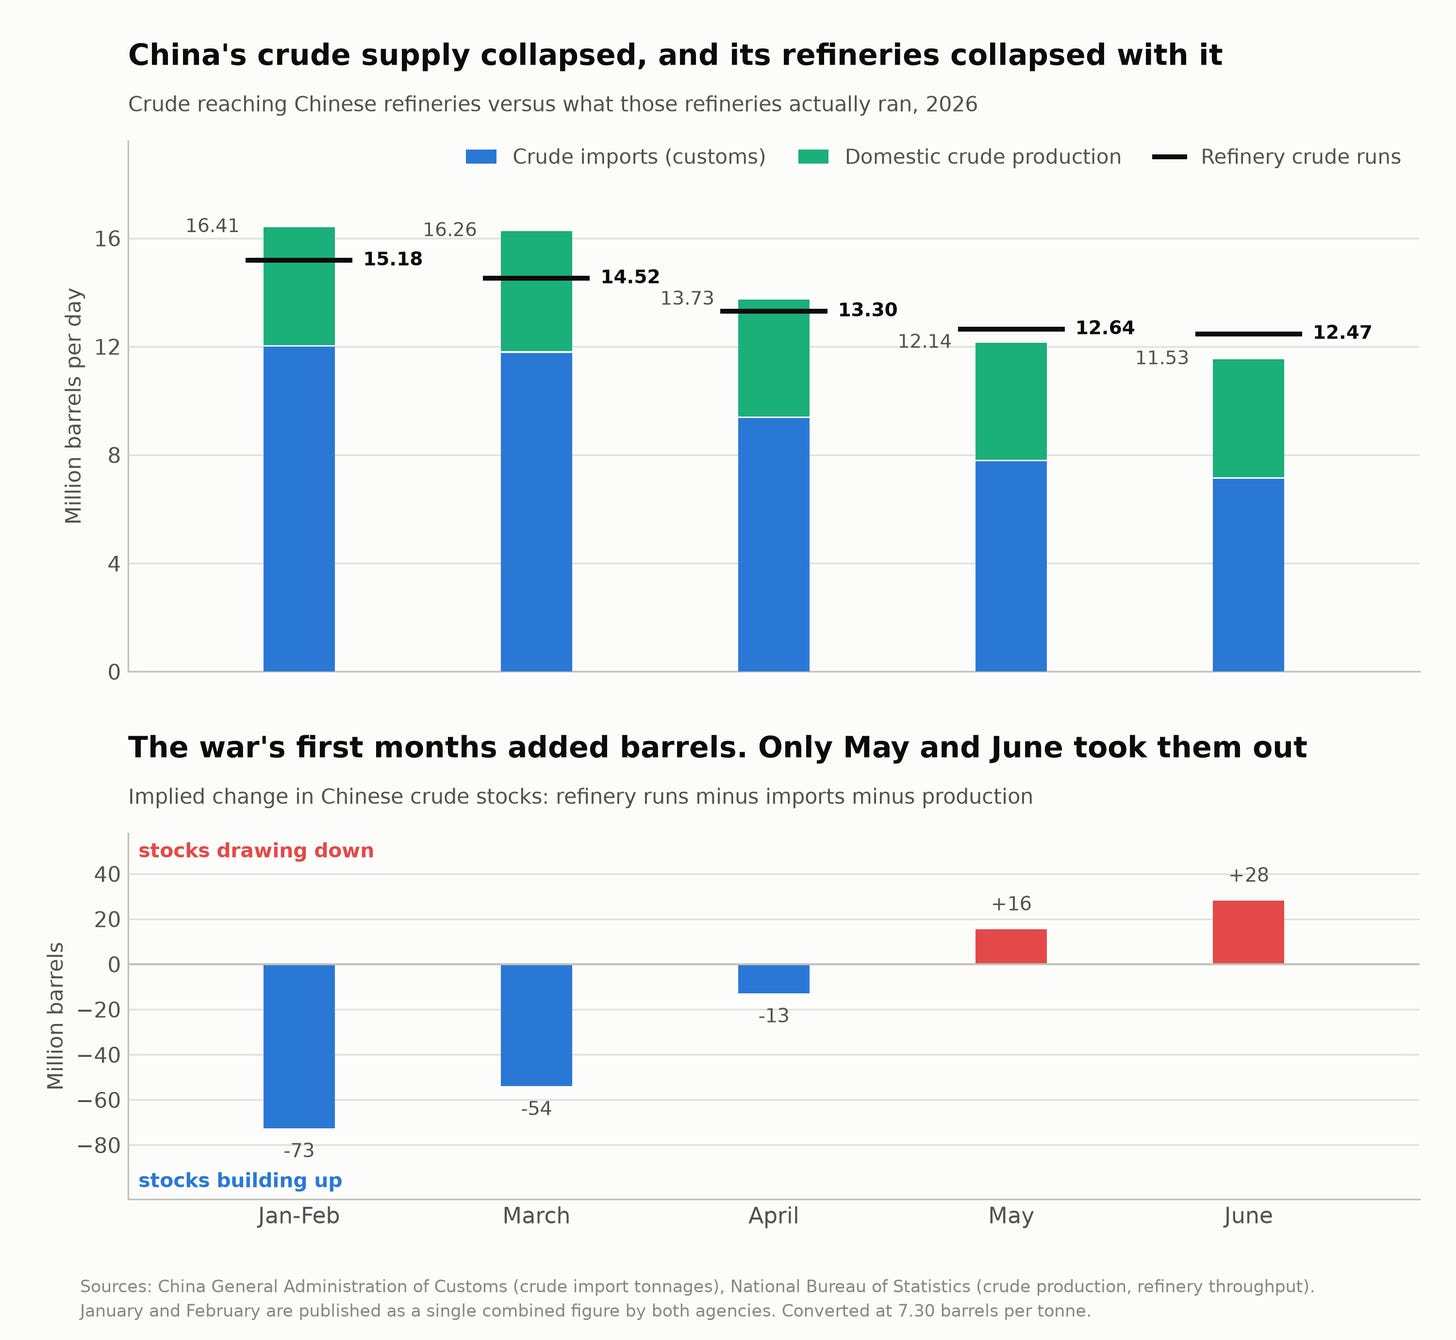
The five million barrels a day mystery shortfall goes away when you correct for the cascade of reporting errors it was built upon. Imports ran 11.77 mbd in March (remember, oil at-sea bought before the closure will still arrive), 9.36 in April, 7.77 in May, 7.12 in June. Refinery runs went 14.52, 13.30, 12.64, 12.47. Domestic production held between 4.37 and 4.49 the whole time.
The claimed 5 mbd shortfall compares the single worst month against the pre-war peak. Apply it across the war’s nearly five months and you get an implied 750 million barrels of missing oil. Compare that against the 2025 average, the March-through-June customs shortfall is 308 million barrels. That is an enormous cut. It is also less than half the implied headline. The difference is the largest single piece of the mystery: barrels that were never bought, from a cut that started six weeks later and ran shallower than advertised. Pick a higher baseline and the cut grows, but so does the pre-war stockpiling that stopped; the storage math lands in the same place.
Refineries did the work
The podcast has this mechanism right, and the official data, published on normal schedule all through the war, says it louder than anyone has been willing to. Chinese refinery runs fell from a January-February average of 15.18 mbd to 12.47 in June, down 17.7 percent year on year in the June NBS release. That is the sharpest drop in the NBS monthly series, which goes back to 2000. Chinese apparent oil demand was down roughly 10 percent year on year by June. Careful: those are the same barrels viewed from two sides, so you never add them. But together they answer the podcast’s open question about how much of the run cut was economics rather than mystery.
Nearly all of it. Reuters reported on May 12 that Shandong’s independent “teapot” refiners were losing 500 to 600 yuan ($74 to $88) per tonne of crude processed, with average operating rates down to 50 percent from 55 percent in April. By late June, Bloomberg, citing JLC, had teapot run rates at 50.5 percent, the weakest since 2017. Refining $100 crude into a market that wanted 10 percent less of it destroyed money, so the refiners stopped.
The strongest evidence that this was economics rather than strategy: Beijing pushed against it. An April 2 directive told independent refiners to keep processing at close to two-year-average rates, and the state issued roughly 55 million tonnes of fresh import quotas to make that possible. The refiners cut anyway. A government running a demand-withdrawal masterstroke does not order its refiners to process more crude in the middle of it.
The tanks did not stay full
The monthly leftovers from the balance tell a story nobody in the mystery debate has told. March was not a draw at all: it was a 54-million-barrel stock build, the pre-war purchases landing. April was still a small build, about 8 million barrels. The draws came in May, 18 million barrels, and June, 29 million. Add it up, March through June, and China’s implied stock change before the bias correction is a net build of about 14 million barrels. On primary data, China’s crude system did not hemorrhage stored oil during the war. It barely dipped into it.
Now compare that against what was publicly visible at the time. Kpler’s satellite monitoring reported a draw of roughly 19 million barrels from Chinese tanks in May. The IEA’s Oil Market Report put the June crude draw at 41 million barrels. Those reported, visible draws sum to about 60 million barrels, which is more than the roughly 47 million the math implies for May and June combined. The podcast’s satellite point, that “until very recently” the floating-roof tanks were “still fuller than they were on March 1,” is a statement about direction with no magnitude attached, and it fits these numbers exactly, because March was a 54-million-barrel build. Tanks fuller than March 1 and 60 million barrels of reported draws are the same picture: stocks rose, then came down modestly.
Pause on that inversion. The Atlantic’s claim that the giant tanks “have remained full since the war began,” and that draws therefore cannot explain the gap, is quantitatively false in the very data cited for it. If anything the reported draws over-explain the crude balance by about 13 million barrels, and a surplus of explanation points away from hidden barrels, not toward them.
The walk from 750 to 33
Assemble the pieces and the mystery falls apart step by step. Start from 750 million barrels, the five mbd headline sustained over the war. Take away 442 million barrels the headline overstates: the actual March-June customs shortfall is 308. Take away 175 million barrels of refinery run cuts. Take away 9 million for higher domestic production. Take away 32 million for pre-war stockpiling that simply stopped. What is left, 93 million barrels, is the total that had to come out of storage of any kind, monitored or not. Now subtract the roughly 60 million barrels of draws that Kpler and the IEA publicly reported while it was happening. The remainder, the barrels that need storage nobody was watching, is 33 million barrels +/- some statistics. Thirty-three million barrels is 0.27 mbd.
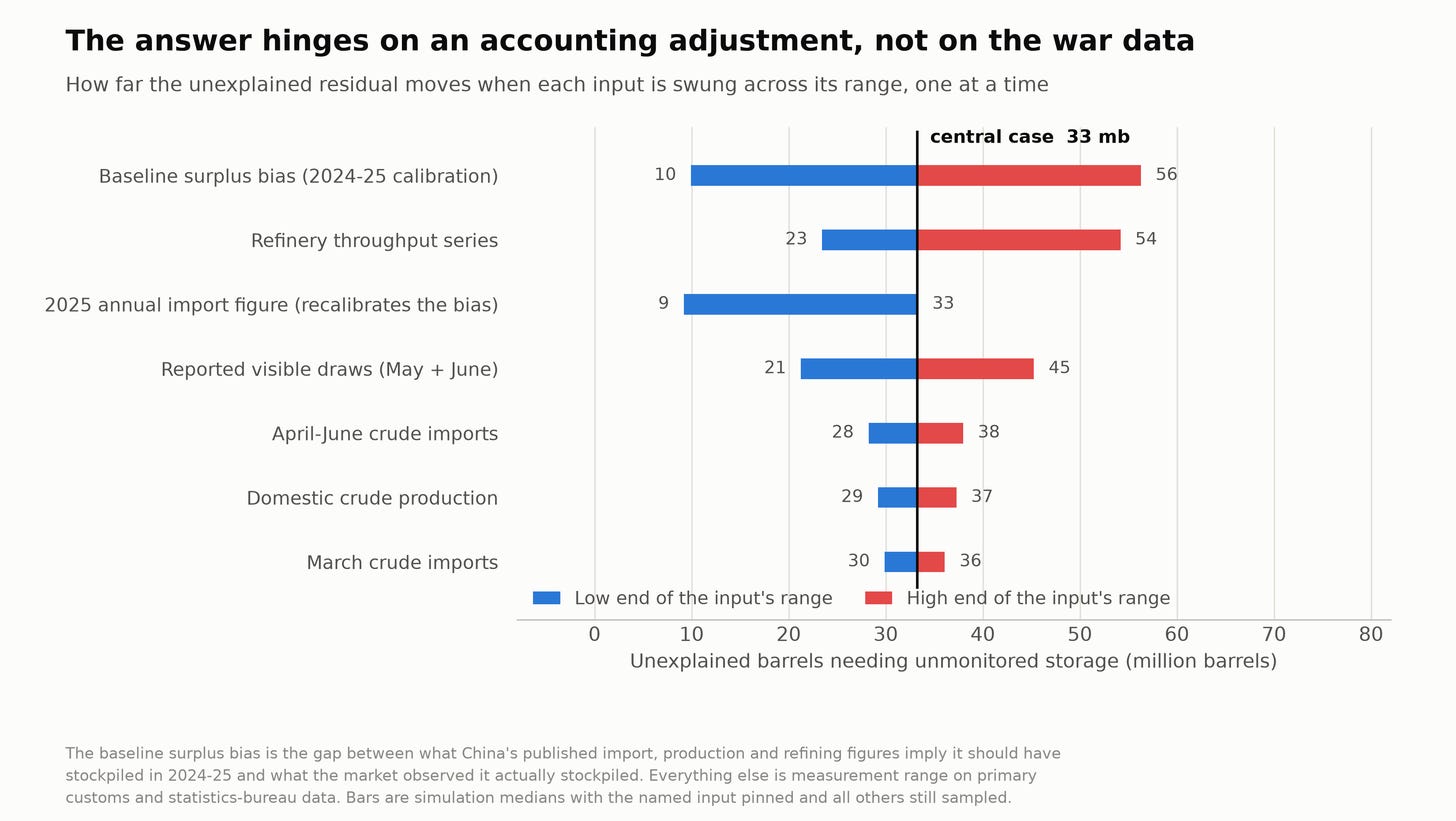
The Monte Carlo’s sensitivity ranking carries one more result I did not expect. The leftover’s swing is dominated by calibrating the bias of how efficient the Chinese oil refining system is (46 million barrels here), the choice of refinery-run series (31), the 2025 baseline import figure (24), and the visible-draw magnitudes (24). The war-month customs numbers, the figures everyone has been arguing about, move it by 10 or less. The mystery was never really about the wartime data. It was about the baseline and the bookkeeping. Why is it always the accountants?
Best Arguments Against This
Johnston was careful on the podcast about what he knew versus what he inferred. Same rules here. My confidence ranking, weakest link first.
The bias calibration of the efficiency of the Chinese refining system rests on two years, because 2024 and 2025 are the only recent years with both complete customs data and independently reported stock builds. Everything swings around these numbers. I am certainly not an oil man, and the key to really good estimates here is higher fidelity modeling of China’s oil importation, pipeline, storage, and refinery system.
The product side is not fully closed. June’s balance needs either the wide demand range I carried or a product-stock draw of about 24 million barrels, and China publishes no verified gasoline and diesel stock series. The podcast’s “Occam’s razor solve,” ample strategic stocks of refined products, lives exactly here, and my numbers cannot kill it. They can only cap it: on the June books it is a 24-million-barrel hypothesis, not a 180-million-barrel one.
The customs-versus-tracker gap is genuinely contested. My reconciliation of GACC against Kpler’s seaborne series says the spring gap is mostly pipeline crude, customs timing lag, and bonded-storage moves, leaving 0.1 to 0.5 mbd of ship-to-ship undercount in April and May. That is my own derived estimate, not an outside figure. The Signal Group, working from AXSMarine flow data, reads the same gap differently: they print a 2.5 mbd customs-minus-waterborne gap with about 1.0 of it pipeline crude, leaving roughly 1.5 mbd they assign to shadow trade through the spring. I think their reading over-assigns. It nets out only pipeline crude, UANI’s tanker tracking has Iranian exports falling to less than half of February’s level by April, and Kpler’s all-route Iran-to-China series is down 14 percent year to date. But notice what the disagreement is about. Re-papered shadow barrels arrive through customs and are already inside the totals this balance is built on, so the dispute is about the composition of China’s imports, not their size. It changes the geopolitics of sanctions enforcement while leaving the storage math where it was. And any barrels that bypassed customs entirely would mean true imports were bigger than the recorded ones, which shrinks the leftover further: this disagreement can make 33 million barrels an overestimate, and it’s never an underestimate.
July is excluded entirely. Official July data publishes in mid-August, tracker estimates for July conflict badly, and it was a partial-reopening month. That math is gonna be tricky.
Here is what would change my mind, on a schedule.
Mid-August, when GACC publishes July. If July imports print far above the 7 to 8 mbd tracker range, the cut ended earlier and shallower than this balance assumes, and the leftover shrinks again.
Mid-September, when NBS July and August refinery throughput is complete. Runs recovering faster than imports would mean a bigger stock draw than I have booked.
The first 60 to 90 days after a durable ceasefire (I’m laughing typing that as hard as you’re laughing reading it). If China runs a months-long surge of two-plus mbd above baseline, the leftover was never 33 million barrels, and the hidden-storage story comes back from the dead with my name on the error.
Any Chinese publication of a product-stock series, or a credible outside estimate of June diesel and gasoline stocks. A verified product draw materially above 24 million barrels breaks the June books as I have closed them.
An official stockpile figure of any kind. Beijing has not published one since 2017; if it does, the cavern capacity this conclusion fits inside is checkable directly rather than inferred.
Harvested, not executed
If the barrels were never missing, the motive question changes shape. The Atlantic asked why China chose to absorb a five-million-barrel sacrifice in silence. There was no five-million-barrel sacrifice. The real question is why China was positioned to ride out a Hormuz closure on refinery economics and a modest, mostly visible stock draw.
That answer is two decades old and fully public. Strategic petroleum reserve phases since 2004. Underground caverns commissioned through the 2010s and 2020s. Eleven new reserve bases added in 2025 and 2026. A national energy law in force since January 2025 that put government and commercial stocks under one reserves framework. Record 2025 imports building stock all year: tracking analysis reported by Reuters put that build at roughly 157 million barrels, and other public estimates run far higher, which would only deepen the cushion. Then a final anticipatory buying surge in January and February as the war premium built. Chinese planners have written openly about the Malacca dilemma for twenty years. This was the insurance policy, and the war was the claim event.
What Beijing actually did during the war was narrower than the mystery framing implies: it steered the shape of an economically driven contraction with export throttles and price caps, and it said nothing. The silence needs no conspiracy. There is nothing heroic in “our refiners lost money so they refined less,” reserve opacity has been deliberate policy since the last official stockpile figure in 2017, and claiming credit for saving the world’s consumers would invite pressure to do it again. China did not execute a wartime masterstroke. It harvested one, and the leverage it gained, the demonstrated ability to go quiet for months without visible strain, is real whether or not anyone in Beijing planned it.
The tell to watch
One behavioral anomaly survives this audit intact: China did not resume buying when Brent touched $72.68 in late June, and less than two weeks later the July 8 re-escalation closed the window. The boring explanations are strong, from elevated war-risk insurance to quota mechanics that cannot swing in ten days. Deliberate restraint, holding the market down or keeping powder dry, cannot be excluded. The test arrives with the peace. In the first 60 to 90 days after a durable ceasefire, fast and price-sensitive restocking says the boring reading was right. Sustained under-buying at attractive prices says China is managing the price of oil on purpose, and the leverage story deserves a second look.
Watch the refill. It will tell us, within about a quarter, whether the two-million-barrel delta was ever anything more than an accounting shadow, and it will tell Washington something more useful: whether the world’s largest oil importer now treats its buffer as insurance, or as an instrument.