
My original blog drafting notes included a cathartic rant about those who distill economic warfare concepts down to bumper sticker sized phrases and caricature sized descriptions. The simplicity leads to simple (and wrong) strategic planning. It’s how Washington ended up with two cartoon Chinas: the ten-foot-tall monster that subsidizes its way to everything, and the bonfire of capital that industrial-policy skeptics wave away. Both cartoons are half right. They are half right about different cells of the scorecard, and neither camp will enjoy seeing the cells side by side.
But I understand now. The financial minutiae is mind numbingly boring. It is really challenging to communicate enough economic complexity to refine the readers intuition, but make it interesting enough that people read it to walk away with a more intuitive understanding.
This capstone does three things. It grades China’s economic warfare machine honestly, cell by cell. It settles the series’ hardest case, semiconductors, at its true weight. And it converts eight posts of measurement into six operating rules a US strategist can carry into a meeting as the economic treaties with China expire this fall. I hope to now make thee knowledge actionable as new economic policy is enacted over the next few months.
Bottom Line Up Front
Here is the machine, graded objective by objective, each grade stated at its own strength.
The one thing China’s state money causally secured is survival. After a government guidance fund buys into a firm, going-concern distress drops measurably (a coefficient of -0.033, p = 0.003, with clean pre-trends). That is a rescue effect, not an improvement effect, and it is the strongest result in this entire body of work.
The economic chokepoints are real and held. In 2024, the latest full reporting year, China held 50 to 72 percent of world exports across five product families: photovoltaic modules at 71.5 percent, rare-earth magnets at 67.3, coated steel at 62.9, lithium-ion batteries at 55.0, cargo vessels at 50.2. Those are reporting-countries-only shares and run slightly high; no plausible correction pulls any of them below half the world market. Capacity and scale gains are real too, but they arrive as associations shaped by selection: the funds pick firms already ahead. Measured capability, productivity and patent quality, was not bought; three independent causal designs return the same null. And the one weapon China has repeatedly fired, mineral export controls, erodes with use, on every window long enough to read.
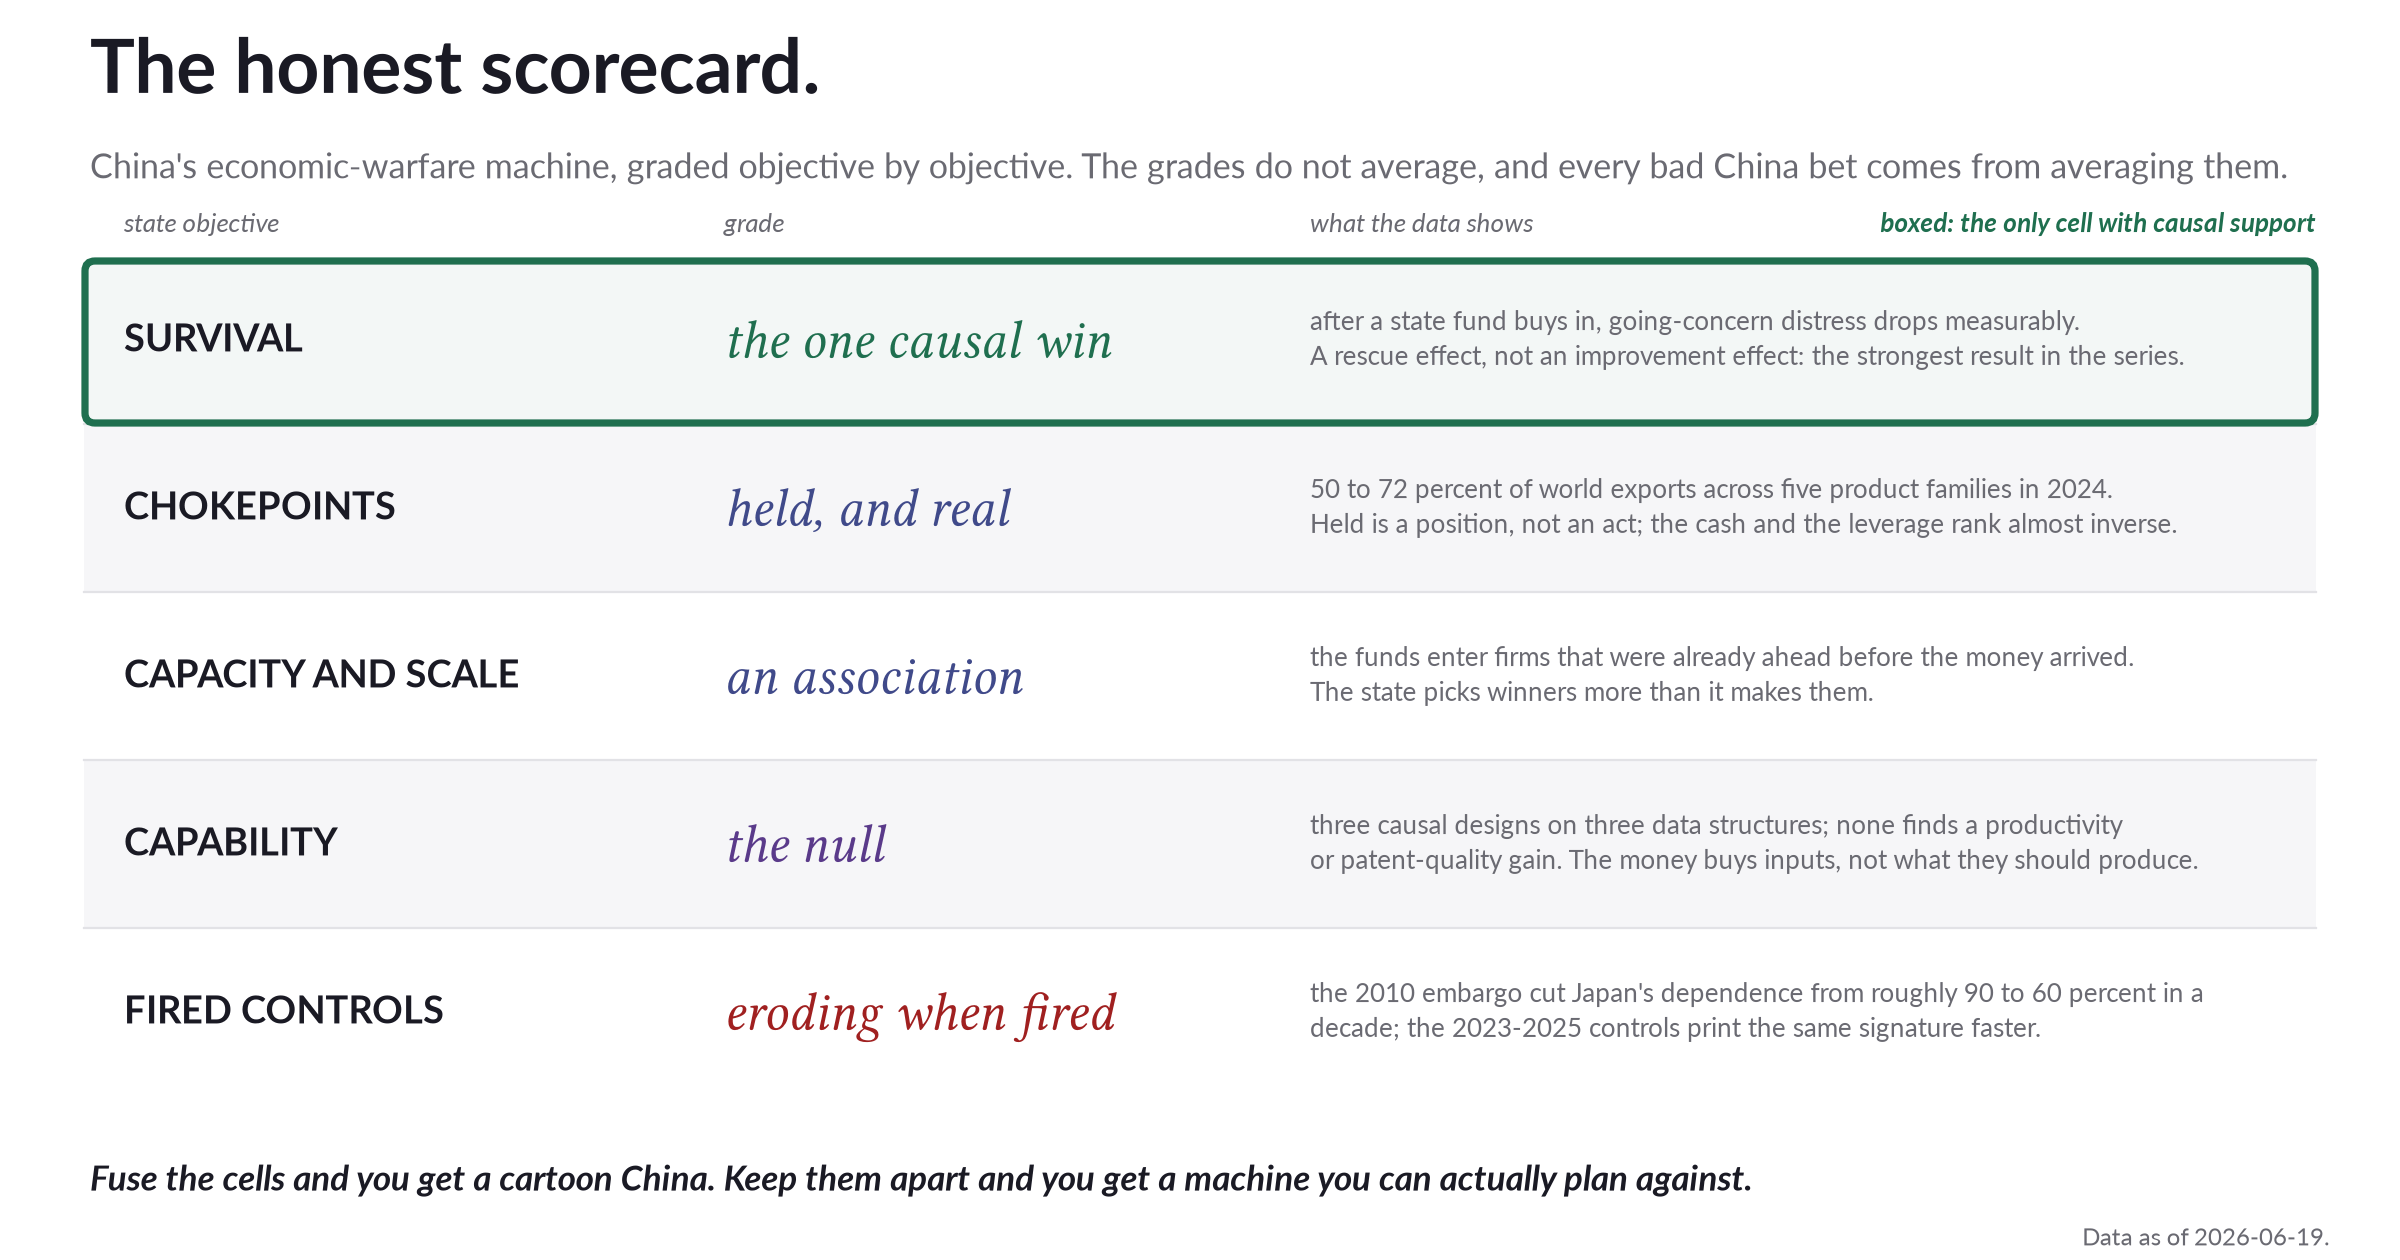
How to read it: five state objectives, each graded in plain words; the boxed row is the only grade with causal support. What to see: the machine won survival and holds chokepoints. Capability never came, and fired controls erode.
The caveats sit here, next to the claims. The capability result is a bounded null. I could detect no positive effect detected at my resolution but did not have enough data to certify Chinese money doesn’t lead to any innovative capabilities or more productive/efficient companies. The erosion grade rests on partner-mirror data because China stopped reporting its own trade after 2024, and the single completed erosion arc is a sample of one. The scorecard is a synthesis of what eight posts measured; it proves nothing new on its own.
What should a decision-maker now believe? That China built a mixed machine: a few dangerous wins, strong held positions, measurable failure modes, and a heaviest bet that is defensive and therefore durable. Plan against that machine. Not the monster, not the spreadsheet.
The findings
1. Walk the scorecard cell by cell, and keep the grades apart from each other. The separation is the whole product. This is what the system does, measured. It is not proof of a secret plan.
Survival is causal. China is deliberately keeping certain firms alive. Fund entry cuts a firm’s probability of going-concern distress, the pre-trends pass, and the effect is the cleanest number in the project. Its qualifiers travel with it: the money is a tourniquet, not a training program. Distress ran 26.4 percent among the delisted casualties against 0.7 percent for core champions and 7.1 percent for their listed peers, so the rescue is being bought for the sickest tier, and inside the state-owned cohort more subsidy tracks more distress, because the money runs toward the bleeding.
The economic chokepoints are held, not caused by the cash. The five families above cleared half of world exports on thin listed-firm money; the magnet position rests on roughly CNY 6.8 billion (about US$0.9 billion) of grants across a decade and a 2021 quota consolidation. Across six measured sectors, the cash and the leverage rank almost exactly inverse (a rank correlation of -0.94, a typology on six points, not an estimated law). The money poured hardest where dominance never came. They haven’t been able to create an economic chokepoint by lighting billions of dollars of money on fire.
Capacity and scale are associations. Subsidy intensity ranks with revenue growth and output scale, but the clean fund-entry design shows the funds entering firms that were already ahead, by about 2.4 points of R&D intensity and roughly 3 to 5 points of sector share, before the money arrived. The state picks winners more than it makes them.
I need to unpack a the apparent contradiction a bit between China using money to keep (distressed) firms alive, and using money to pick the winners from companies doing well. The state runs two tools with opposite selection signatures. Strategic equity funds buy equity in firms already ahead of their peers and causally lower their failure risk: they pick winners and insure them. Broad grant subsidy, especially to SOEs, pools in the weakest firms, a keep-alive tilt that shows up as correlation.
Capability is the null. Three causal designs on three data structures, a withdrawal difference-in-differences, a tax-threshold discontinuity, a staggered fund-entry study, and none finds a productivity or patent-quality gain. Among subsidized firms, more subsidy ranks with slightly lower patent quality, about -0.20. The money buys reported R&D and scale. It does not buy what those inputs are supposed to produce.
And the fired economic weapon erodes. The direction is consistent everywhere the window is long enough: the 2010 embargo cut Japan’s China-dependence from roughly 90 to roughly 60 percent over the following decade; gallium and germanium flows ran at about 0.60 of pre-control value across 31 months at a flat price; graphite at about 0.47 with no premium; antimony collapsed to about 0.15 of volume at 3.2 times the price, a pattern that is ambiguous by construction; the April 2025 magnet regime, eleven months in, sits near 0.94 and is not yet a verdict. All of it reads through the partner mirror, median-unbiased and product-level noisy. Erosion is where the evidence leans, stated as a lean.
Why belabor the grades? Because every bad China opinion poiece and policy that I have read this year comes from averaging them. Fuse the cells and you get either “it all works” or “it all fails.” Keep them apart and you get a machine you can actually plan against.
2. The semiconductor bet is defense, so expect persistence. The heaviest cash in the panel sits on chips: 7.3 percent of listed-firm revenue in support intensity, plus roughly CNY 368 billion (about US$51 billion) of state equity through the national chip funds. On the offensive scorecard that bet is a clean miss. China is the world’s largest importer of integrated circuits, the import bill rose from about US$250 billion to about US$413 billion across the buildout decade, and in January and February 2026, after more than three years of allied export controls, it was still rising: 550 billion yuan (about US$76 billion) of imports, up 36.8 percent year on year by value and 9 percent by volume. You will hear that China’s chip exports are surging too. They are, up nearly 70 percent in the same months, and they are overwhelmingly mature-node. The exports are the chips China can make. The imports are the ones it cannot.
Now put that miss next to the map from the previous post: the deepest feasible chokepoint anyone holds against China is the semiconductor toolchain. The heaviest cash landed on the deepest inbound dependence. That is not a failed bid for export dominance. It is a rational defensive bet on the one input whose denial China fears most, and a rational defensive bet does not get abandoned when the first decade looks ugly. It gets doubled.
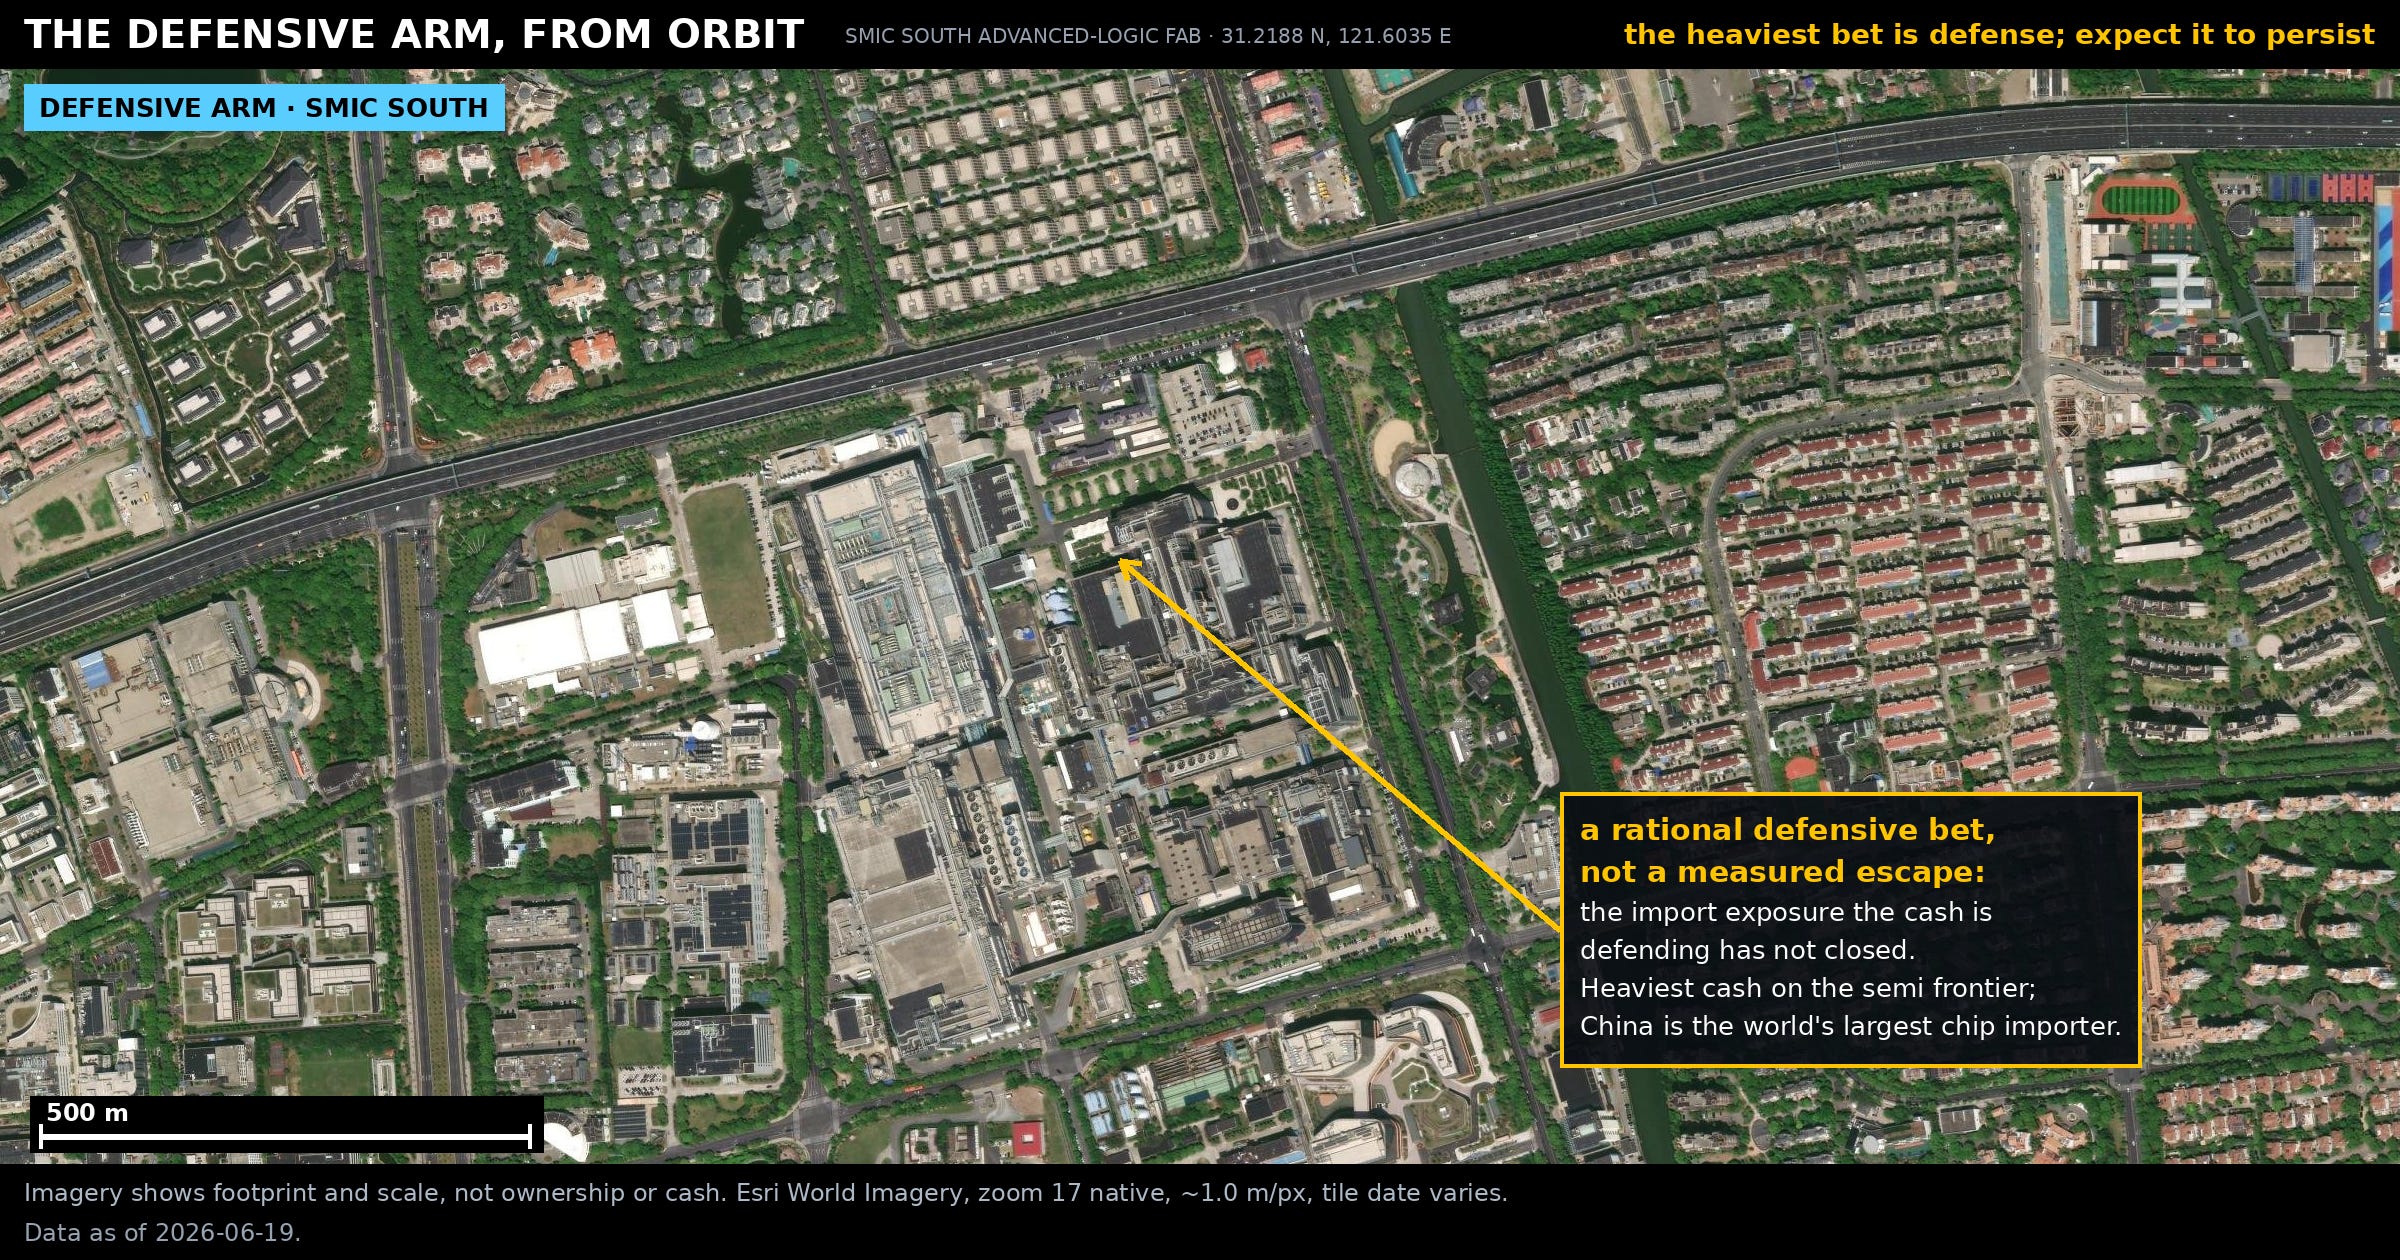
How to read it: an annotated overhead of the flagship logic fab, marked as the defensive bet it is. What to see: the heaviest cash in the ledger guards the way in, not the way out.
Hold the wording precisely, because both halves are important. Rational defensive bet, not a measured escape. The capability null covers chips too, the import bill is growing in the wrong direction for the escape story, and nothing in my data shows the exposure closing. What the defensive read changes is the forecast: Washington should expect Chinese chip spending to persist regardless of measured returns, because the yardstick in Beijing is exposure, not profit. Budgeting for your rival to get discouraged is not a plan. The allied Asian and Western firms who are forgoing revenue to maintain the chip ban will be paying that opportunity cost for a long time.
3. What happens after the money moves on: four patterns, honestly bounded. The series also watched sectors after they stopped being the top priority, and four shapes emerged, split by one variable: supply discipline. Solar, demoted without a capacity cap, was buried by its own glut, net margins down about 5.4 points with three of the sector’s five listed-census delistings inside the post window. Steel and aluminum, demoted under caps, compressed about 3.6 points and survived, casualties near zero. Rare earths became a ward: margins actually rose about 1.6 points after demotion because quotas and licenses prop pricing in a way cash never did. Electric vehicles switched instruments, the visible purchase subsidy fading into tax and demand channels while the sector kept growing, which is why a falling grant line must never be read as abandonment. These are associations on a small set of dated triggers, casualties included, and they are shapes, not laws; agriculture is the standing warning, a sector whose sign flips from -0.47 to +0.86 points depending on whether you count the firms that died.
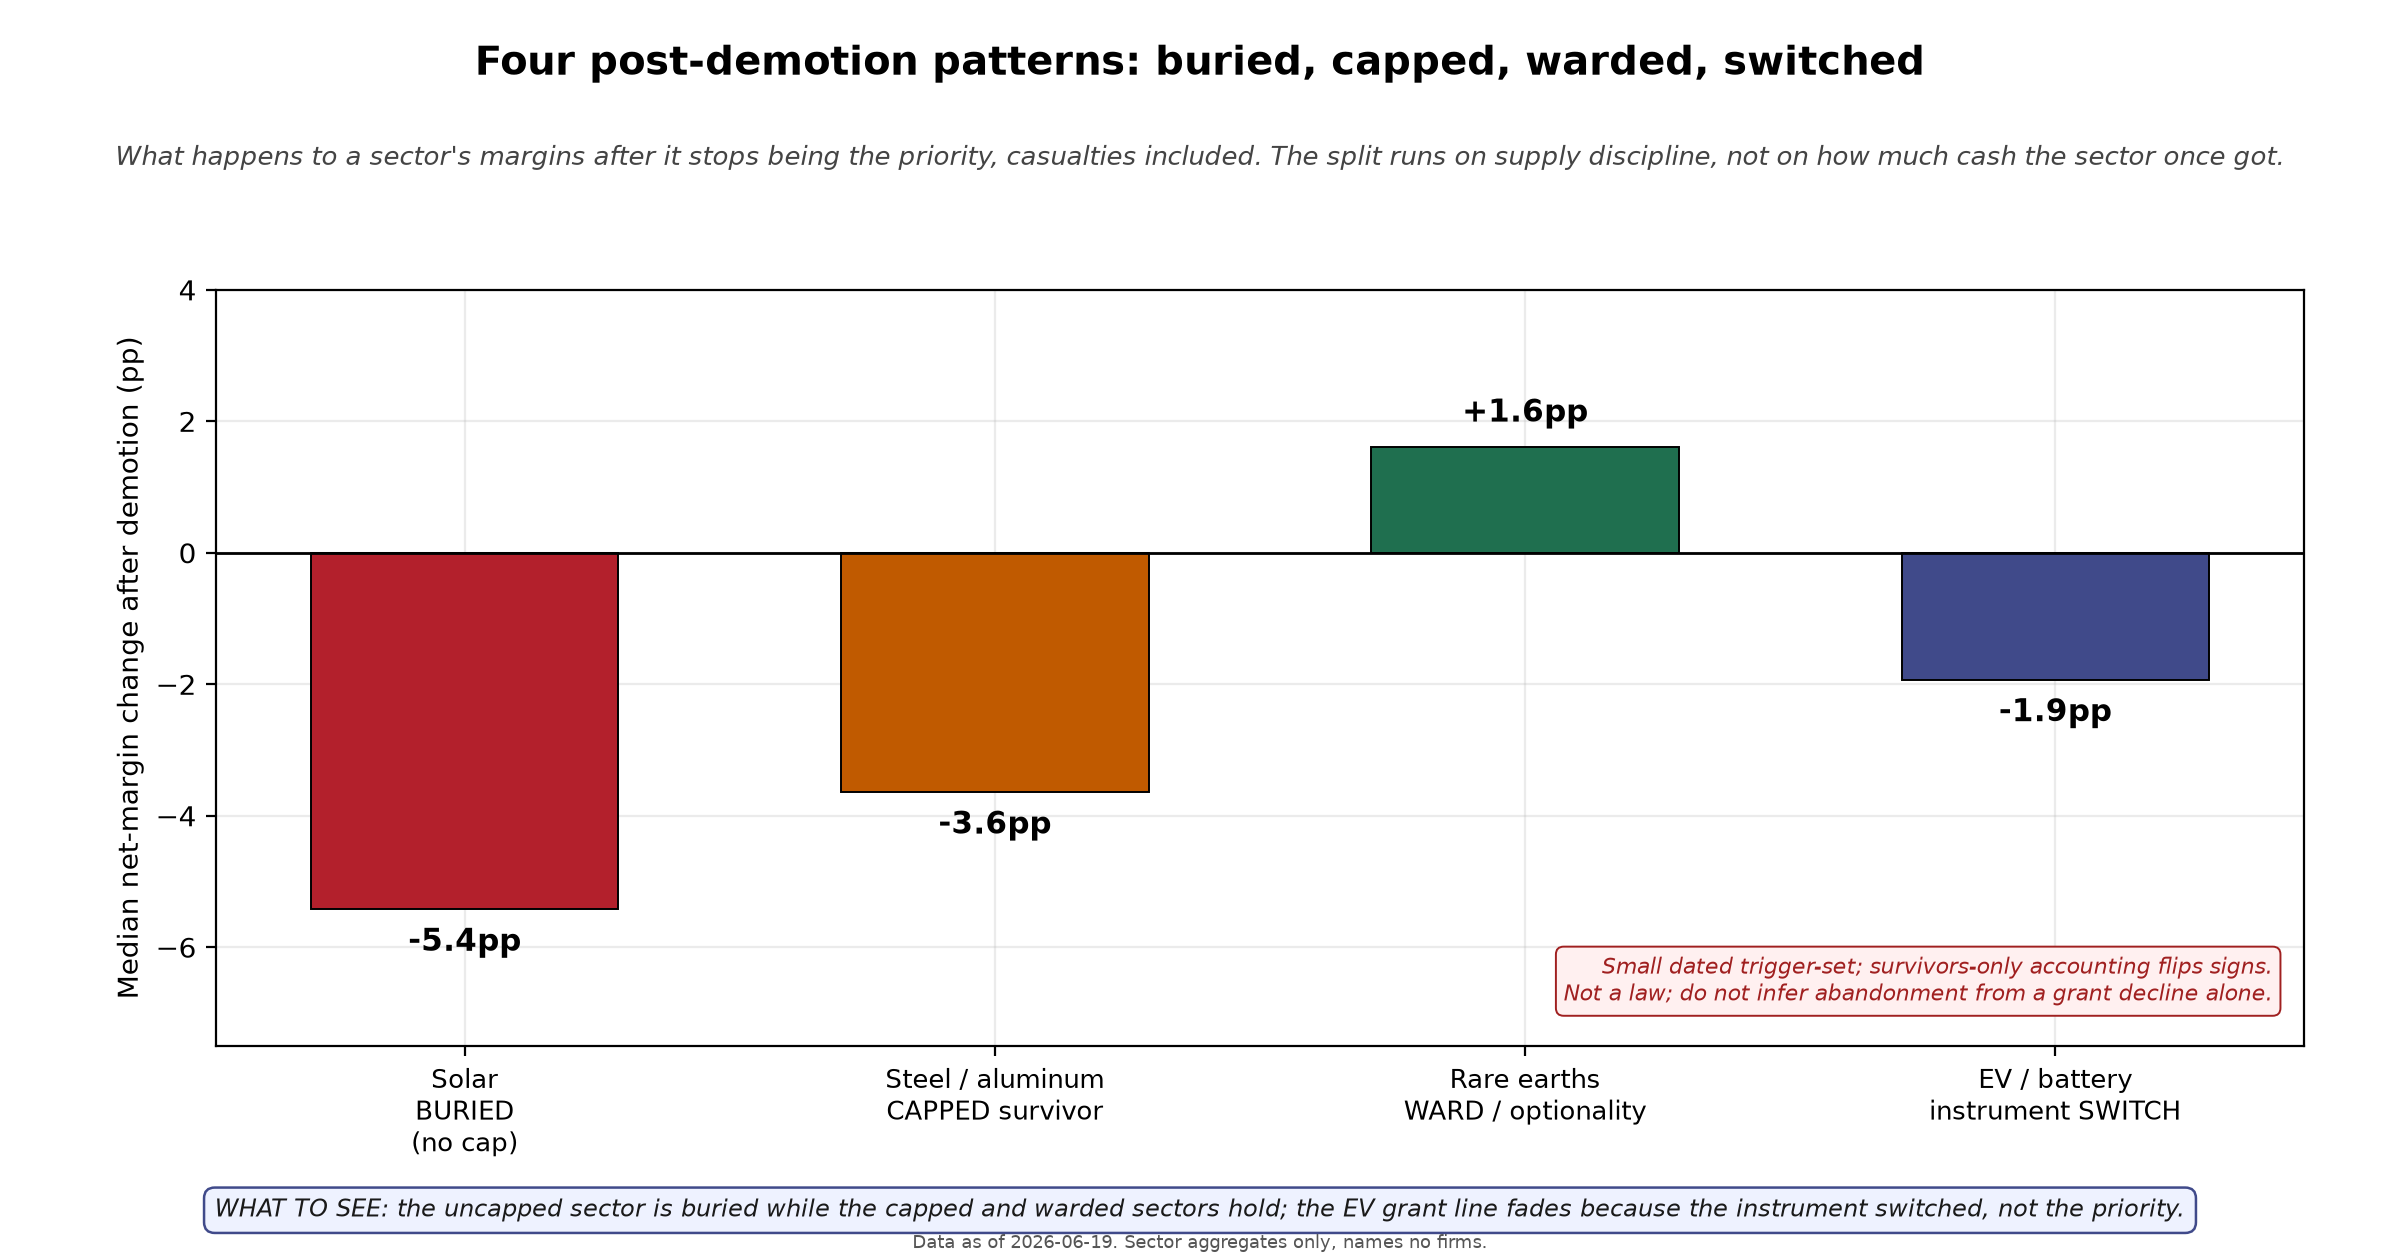
How to read it: each bar is one demoted sector’s median net-margin change after demotion, casualties included, labeled by its pattern. What to see: the uncapped sector is buried while the capped and warded sectors hold; the split runs on supply discipline, not on how much cash the sector once got.
A. Four post-demotion patterns generated/post8_body_gen_a.png
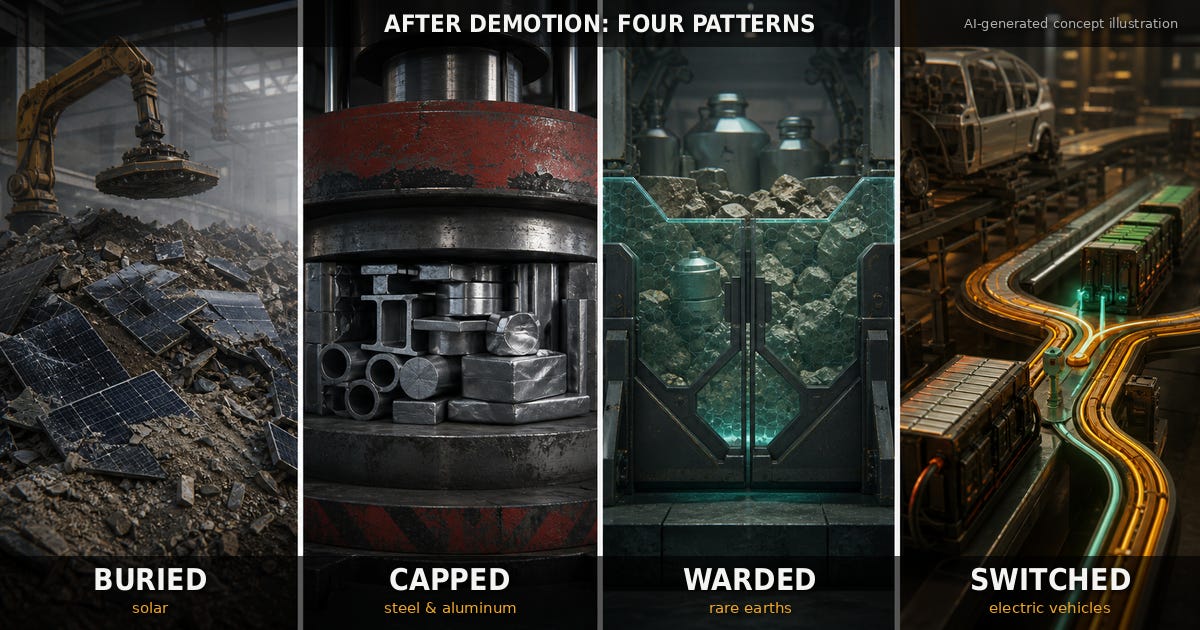
The pattern earns its place on the scorecard for one reason: Beijing read it the same way. Watching solar bury itself, the state reached for a capacity-retirement campaign, not a rescue check. The machine grades its own homework, and it looks like I graded it the same way.
4. The playbook. Everything prescriptive this series has to offer fits in six rules on a 4x6 index card:
Read Beijing’s subsidy ledger as a fear map, not an ambition map. Across the six measured sectors, cash and leverage rank inversely; the money marks where China feels exposed, and the intensity ranking is a free intelligence product on where the next yuan goes.
Do not build any plan whose load-bearing assumption is that China’s weak firms eventually die. Survival is the machine’s one causal win; the shakeout you are waiting for is the specific thing the money prevents.
Track caps, licenses, and ownership consolidation, not budgets. One capacity ceiling separated record aluminum profits from solar’s casualty list, and the only chokepoint China has repeatedly fired runs on quotas and licensing built on a rounding error of cash; budget telemetry misses every decisive instrument.
Force the fire-early-or-never dilemma, then spend every firing on diversification. Fired controls erode on every readable window, the 2010 embargo bought Japan a decade of measured de-risking, and closed routes respawn one border over within a year; a firing is a dated, free lesson in where dependence binds, and it expires.
Fight on the narrow allied front, not the deepest dependence. Vulnerability and feasibility are different axes; the workable levers sit in chip equipment, metrology, and high-bandwidth memory, where a US-Netherlands-Japan bloc holds roughly 56-66 percent of supply and China’s own category exports run 1.4-1.9 percent, while food, the deepest-looking dependence, is exposure, never a lever.
Assume the telemetry dies, and write mirror-based verification into every regime. China’s official trade feed has a documented off switch, dark since calendar 2024, and any deal, snap-back, or reporting requirement written against data the counterparty can switch off is written on sand; build the partner-mirror check in from day one.
That list is the whole series.
5. Why this lands now: every clock rings in fall 2026. The Busan truce of October 30, 2025 was a one-year pause, not a settlement, and its expiries are specific. China’s October 2025 rare-earth expansion, including the extraterritorial rule reaching any foreign magnet with 0.1 percent Chinese-origin content, is paused until November 10, 2026. Its US-directed gallium, germanium, and antimony ban is suspended until November 27, 2026. Washington’s Affiliates Rule is suspended until November 9, 2026. The April 2025 licensing regime on seven rare earths never paused at all, and controlled exports still ran roughly 50 percent below pre-control levels into the May 2026 Beijing summit. The two presidents meet again in September 2026, weeks before all three alarms ring. Rules 4 through 6 are not evergreen advice; they are dated homework.
The US instrument stack has meanwhile been stress-tested down to its durable core. The Supreme Court struck down the IEEPA tariffs in February 2026; their stopgap replacement, a 10 percent surcharge under Section 122, expires July 24, 2026 absent congressional action. What survived untouched is Section 301: 100 percent on Chinese EVs, 50 percent on solar, 50 percent on semiconductors, with graphite, magnets, and non-EV batteries added at 25 percent from January 1, 2026. Section 301 is the durable US core any next bargain gets built on. And Washington has begun answering the machine in its own grammar: a 9.9-10 percent federal stake in its flagship chipmaker converted from grant money in August 2025, a roughly 15 percent defense-department stake in its flagship rare-earth miner with a ten-year price floor at US$110 per kilogram, about double the miner’s 2024 realized price. The strongest tell that the channels are the weapon is that the other side has started copying them.
Best Arguments Against This
The strongest attack: the semiconductor shield relabels a miss. The cash went in, dominance never came, imports rose, and calling that “defense” rescues a failed program with vocabulary. I concede the entire offensive record, and the defensive read still earns its place, for two reasons. It is the only reading that holds three facts at once, the heaviest cash, the clean export miss, and the deepest inbound chokepoint sitting on the same sector. And it is falsifiable where a rhetorical rescue would not be: if subsidy simply chased vulnerability, chemicals, where China is 90 to 100 percent import-dependent on key feedstocks, should be drowning in state money, and it gets almost none. The defensive read is a per-sector judgment that happens to fit the biggest bet, not a law. The moment the import bill falls with capacity holding, the bet becomes an escape. It has not.
The second attack: both camps can cherry-pick this scorecard. The hawk quotes the held chokepoints; the skeptic quotes the capability null; my own matrix arms them both. Correct, and that is the finding, not a flaw in it. The camps are each half right about different cells, which is precisely why single-grade answers have produced a decade of bad China takes. The scorecard’s discipline is that no cell travels without its grade. Anyone quoting one row of it as the whole verdict is doing opinion with my footnotes.
What Would Change My Mind
A measured semiconductor escape: the IC import bill falling for four consecutive quarters while wafer capacity holds, checkable by mid-2027. As of January and February 2026 the bill was growing 36.8 percent year on year, the wrong direction for this trigger.
A fired control that holds: the April 2025 magnet regime printing four clean post-control quarters of sustained share and sustained volume at a price premium, readable in early-to-mid 2027. That would break the erosion grade where it matters most.
A citation-weighted Chinese, European, and world patent panel showing state support associated with rising per-patent quality. That panel is not public data, and it is the named falsifier for the capability null.
The close
Eight posts ago this project set out to measure a machine everyone had already made up their mind about. The measurements came back mixed, and the mix is the message: one causal win, real held positions, a defensive bet that will persist, a capability engine that never started, and a weapon that depreciates when fired.
The machine was not built to win. It was built to not lose. You do not out-wait a machine like that. You out-position it.
exeunt