
One of the hardest factors to communicate in cyber warfare has been the consequence of time on the arsenal. Unused kinetic weaponry lasts for years if not decades if properly cared for. Cyber weaponry has a random decay where it may stop working at any time without any warning. Plotting Japan’s rare-earth dependence after China’s 2010 embargo was eye opening. The economic weapon fired in 2010, and then it spent a decade losing yield. I had been reading China’s export-share charts like an arsenal of strategic weapons that loses effectiveness as adversaries work to counter their capability. The chart said to read economic weapons as if they gradually lose yield after they’re fired.
That distinction, between what China holds and what happens when China fires, is the most consequential thing the trade data has to say about economic coercion. Washington mostly argues about the first chart, the dominance shares, and treats the second question as a matter of opinion. It is not a matter of opinion. Beijing has now fired the weapon enough times to grade it.
So this post grades it. Held first, fired second, and the seams between them are where the strategy lives.
Bottom Line Up Front
China’s export chokepoints are real, and the moment Beijing fires one they start losing it. Those are two different findings, and the policy debate keeps fusing them into one. As of 2024, the latest full reporting year, China held roughly 71.5 percent of world photovoltaic (PV aka solar panel) module exports, 67.3 percent of neodymium-iron-boron (NdFeB) magnets, 62.9 percent of coated steel, 55 percent of lithium-ion batteries, and 50 percent of cargo vessels. These are reporting from receiving countries, so they run slightly high, but no plausible correction drags any of them below half the world market. In strategic parlance, China is holding their adversary’s economic infrastructure at risk.
Firing these economic weapons behaves differently. The one completed case is the 2010 rare-earth embargo on Japan: Japan’s dependence on Chinese supply fell from roughly 90 percent to roughly 60 percent over the following decade. The 2023-2025 controls are printing the same signature faster, on partner-mirror reconstructions of trade China no longer reports. Gallium and germanium: exercised flow down about 40 percent in 31 months at a roughly flat price. Graphite: flow roughly halved with no price premium. Antimony: volume at about 0.15 times pre-control and price at about 3.2 times, a pattern that is ambiguous by construction. The April 2025 magnet controls are eleven months in, a dip and then a recovery, but too early to declare a verdict.
The honesty note sits up front: China stopped reporting its own trade after calendar year 2024, so every post-2024 number is rebuilt from what the rest of the world says it imported from China. That mirror is unbiased at the median and wide product by product. Erosion-on-firing is therefore the hypothesis the evidence leans toward, not a measured law; the single completed arc is a sample of one. The research data was current as of June 19, 2026.
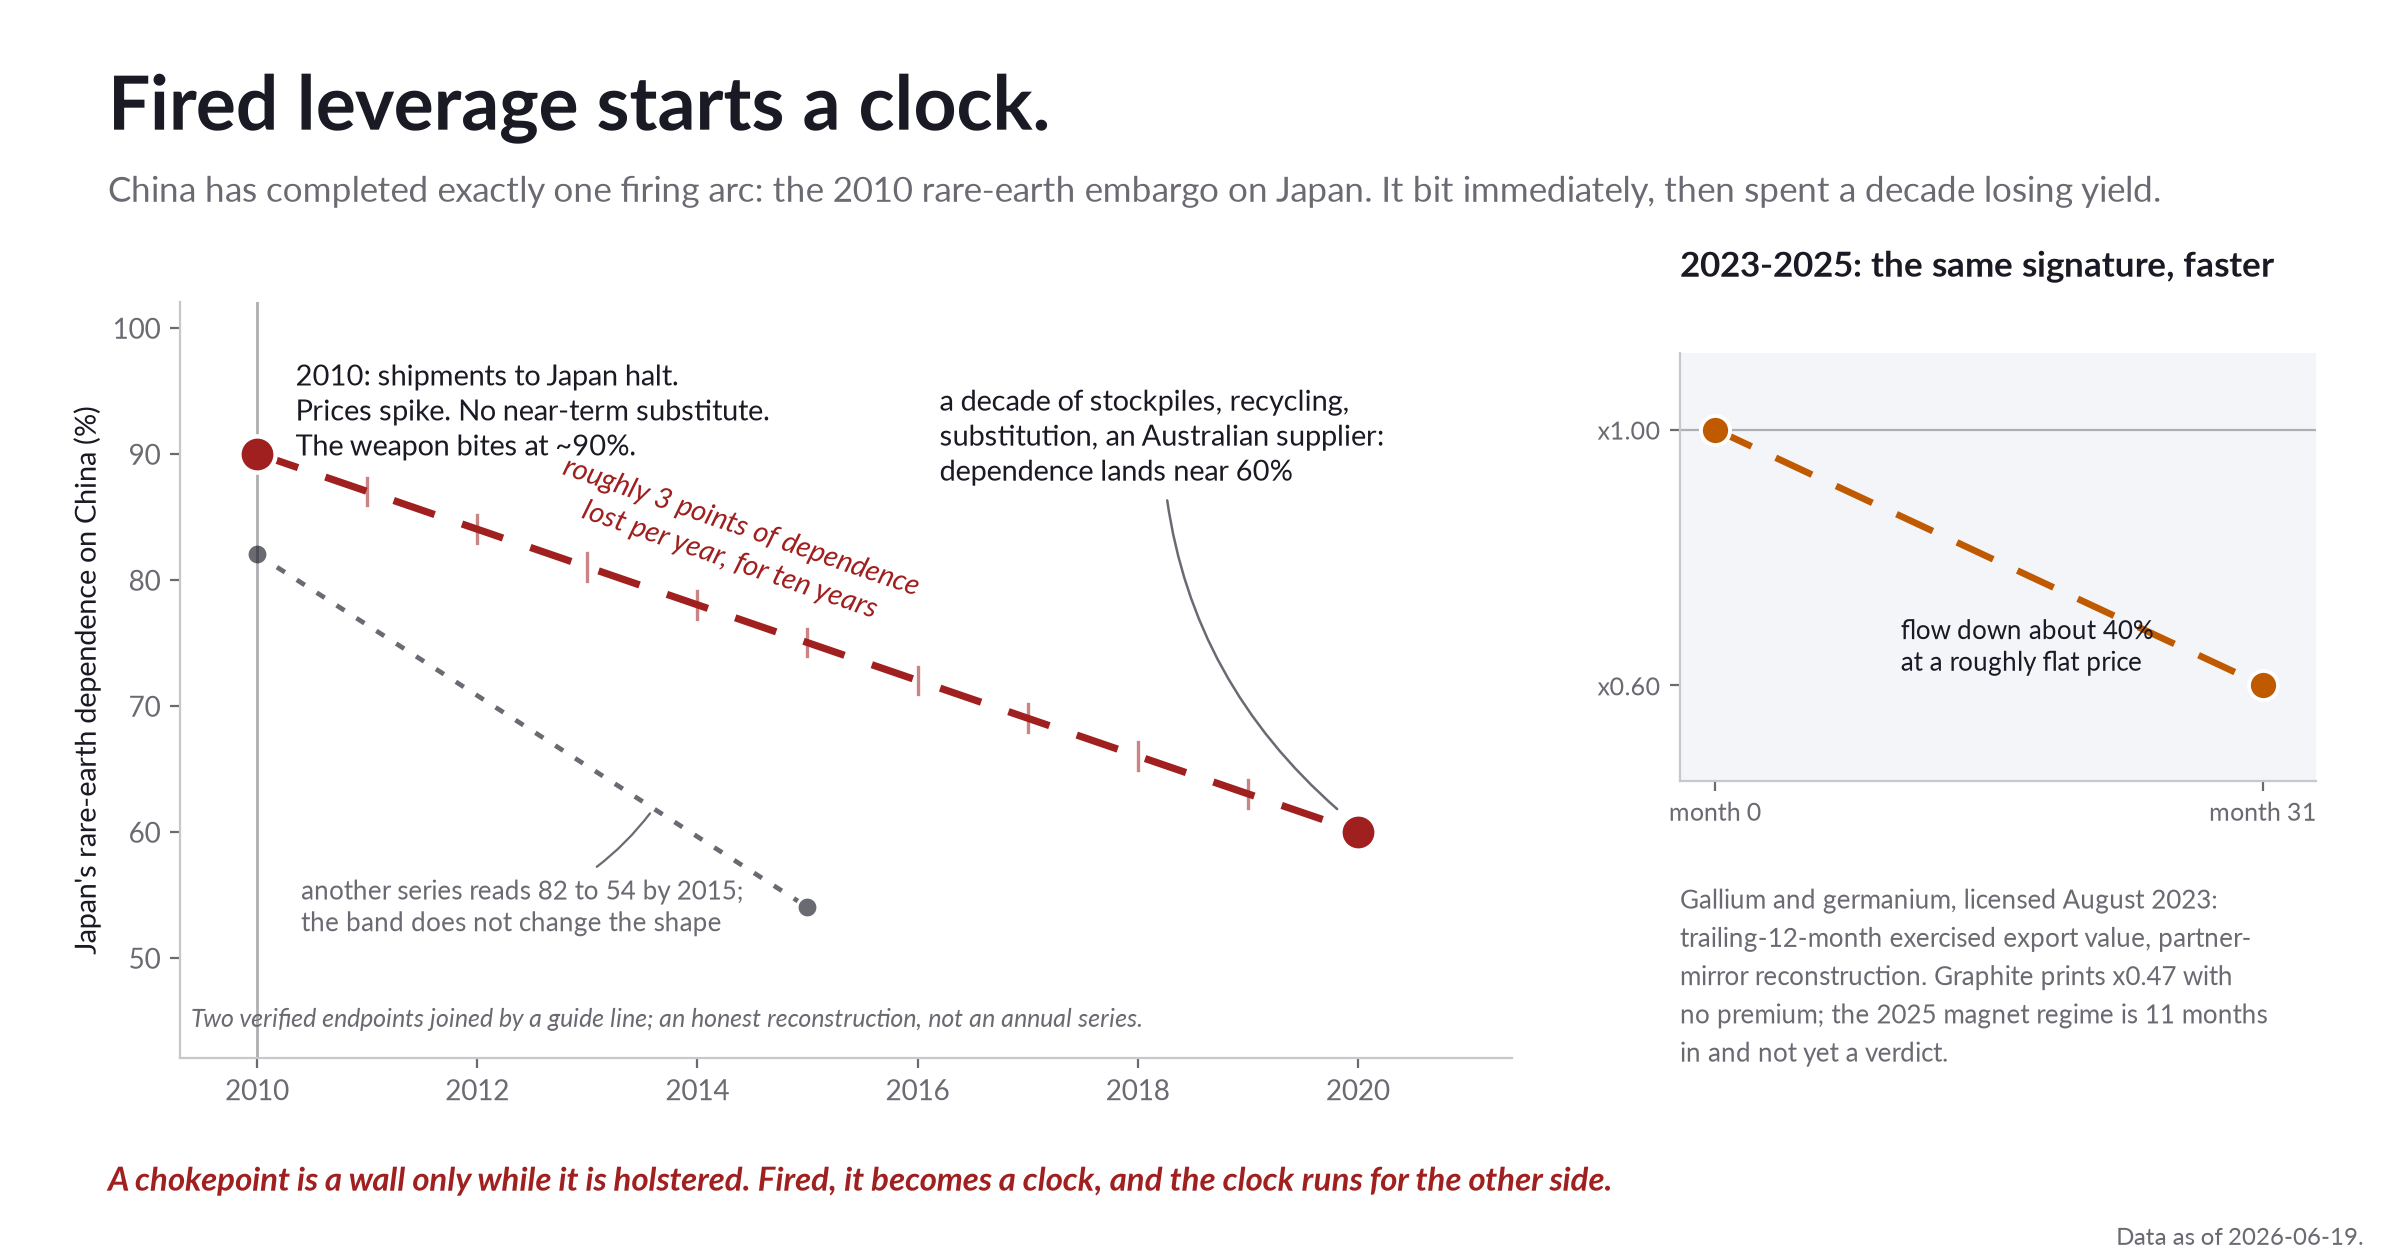
How to read it: Japan’s dependence on Chinese rare earths after the 2010 embargo, with an inset showing the 2023-2025 controls printing the same shape faster.
What to see: fired leverage starts a clock, and every firing since runs the same decay, quicker.
The strategic translation: expect threats more often than embargoes. Held beats fired, and Beijing’s own behavior, pausing its broadest controls for exactly one year at the October 2025 Busan truce, reads like a government that has seen its own scorecard. Every one of those pauses expires in fall 2026. The clock only pays the defender if the warning is spent on diversification rather than relief.
The findings
1. The held inventory is wide, one-sided, and stamped 2024. Beyond the five families above, electric buses sit at 50.8 percent of world exports and lithium hydroxide, the battery-grade midstream chemical, at about 80.1 percent. The deeper feature is asymmetry: the dependence mostly runs one way. On a reverse-dependence index built from the same trade data, coated steel scores about 77.6, magnets 68.8, PV modules 59.2, and batteries 52.9. The rest of the world buys from China; China buys little back. Cargo vessels post a 99.9 on that index but we need to be very careful with that number: China imports almost no ships, so the denominator is tiny and the ratio explodes. The 50.2 percent export share is the useful ship number.
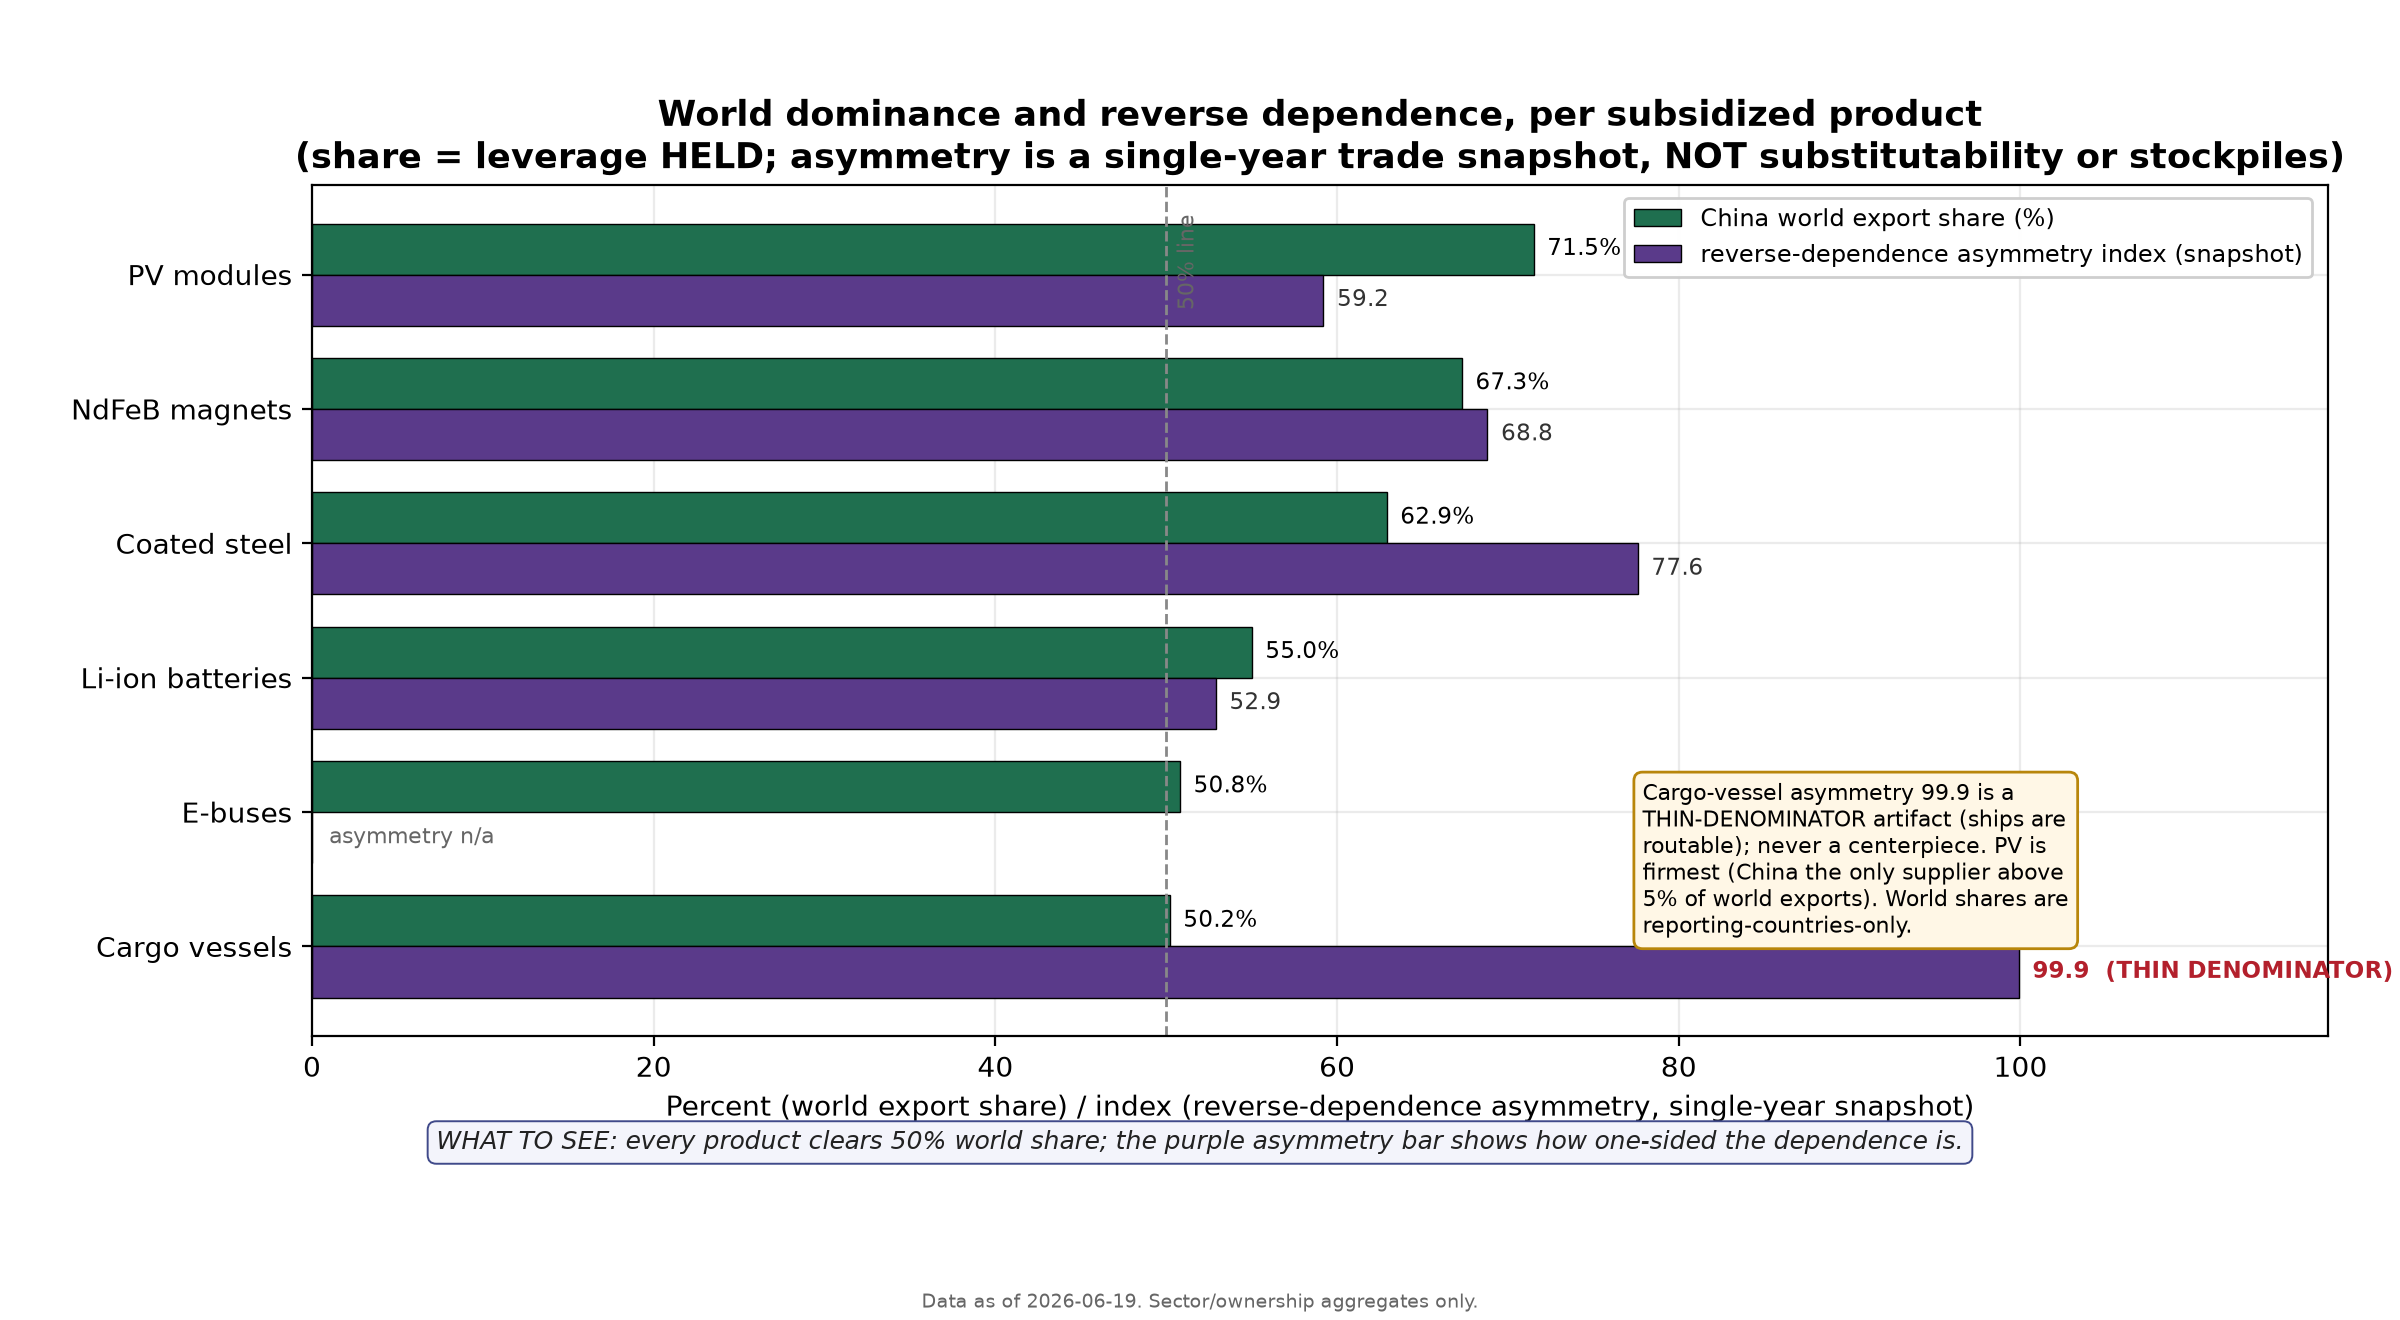
How to read it: green bars are China’s share of world exports in 2024, the latest full reporting year; purple bars are a single-year index of whether the dependence runs one way.
What to see: five product families clear 50 percent of world exports with one-sided dependence; the cargo-vessel 99.9 is a thin-denominator artifact, not the story.
Two caveats belong next to the inventory, not after it. First, asymmetry is not substitutability. The index reads one year of trade. It cannot see stockpiles, inventories, or how fast a buyer can qualify a second source, and those are what decide whether a held position can be fired without self-harm. Second, the mineral positions, rare earths above all, run on refining share and licensing machinery rather than visible subsidy cash; that structural machinery was Post 4. And the stamp matters: if you saw January 2026 headlines about China’s shipbuilding share falling, those describe 2025 new orders, roughly 63 percent of tonnage ordered and the first decline in five years, a different metric from the 2024 delivered-vessel export share, and both are true. One position is already sliding on its own: coated steel peaked at 68.6 percent in 2022 and sits at 62.9, roughly a sixteen-year half-life at that pace. A held position is not a permanent one. It is just the strongest form the leverage will ever take.
2. Caveat lector: the data went dark. China filed its 2024 trade with the United Nations trade database (UN Comtrade) in June 2025 and has filed nothing since; calendar 2025 onward is blank. The blackout sits exactly where the fired-control question lives. The workaround is a partner mirror: add up what every other country reports importing from China. Validated against China’s own 2014-2024 filings, the mirror is unbiased at the median, a ratio of about 1.02, but only about a third of product-years land within ten percent of truth, and the loosest lines are exactly the small mineral flows these controls touch. Worse, the mirror is annualized: the within-year halt, the weeks when licenses simply do not issue and the weapon actually bites, is invisible in available data. This is a bad place to bluff. So every grade below is a run-rate the mirror can support.
3. Every completed economic weapon firing shows the same arc: bite, then erosion. Walk the one finished case concretely. In 2010, during a territorial dispute, China halted rare-earth shipments to Japan. The embargo bit immediately; prices spiked; Tokyo had no near-term substitute. Then Japan spent the decade on stockpiles, recycling, substitution, and an Australian supplier, and its China-dependence slid from roughly 90 percent to roughly 60 percent. Some series put the slide at about 82 to about 54 percent by 2015; the band does not change the shape. The diversification is partial, heavy rare earths and processing dependence remain far higher than the headline, and Beijing is now re-applying pressure to the same target, tightening magnet-technology licenses aimed at Japan in January 2026.
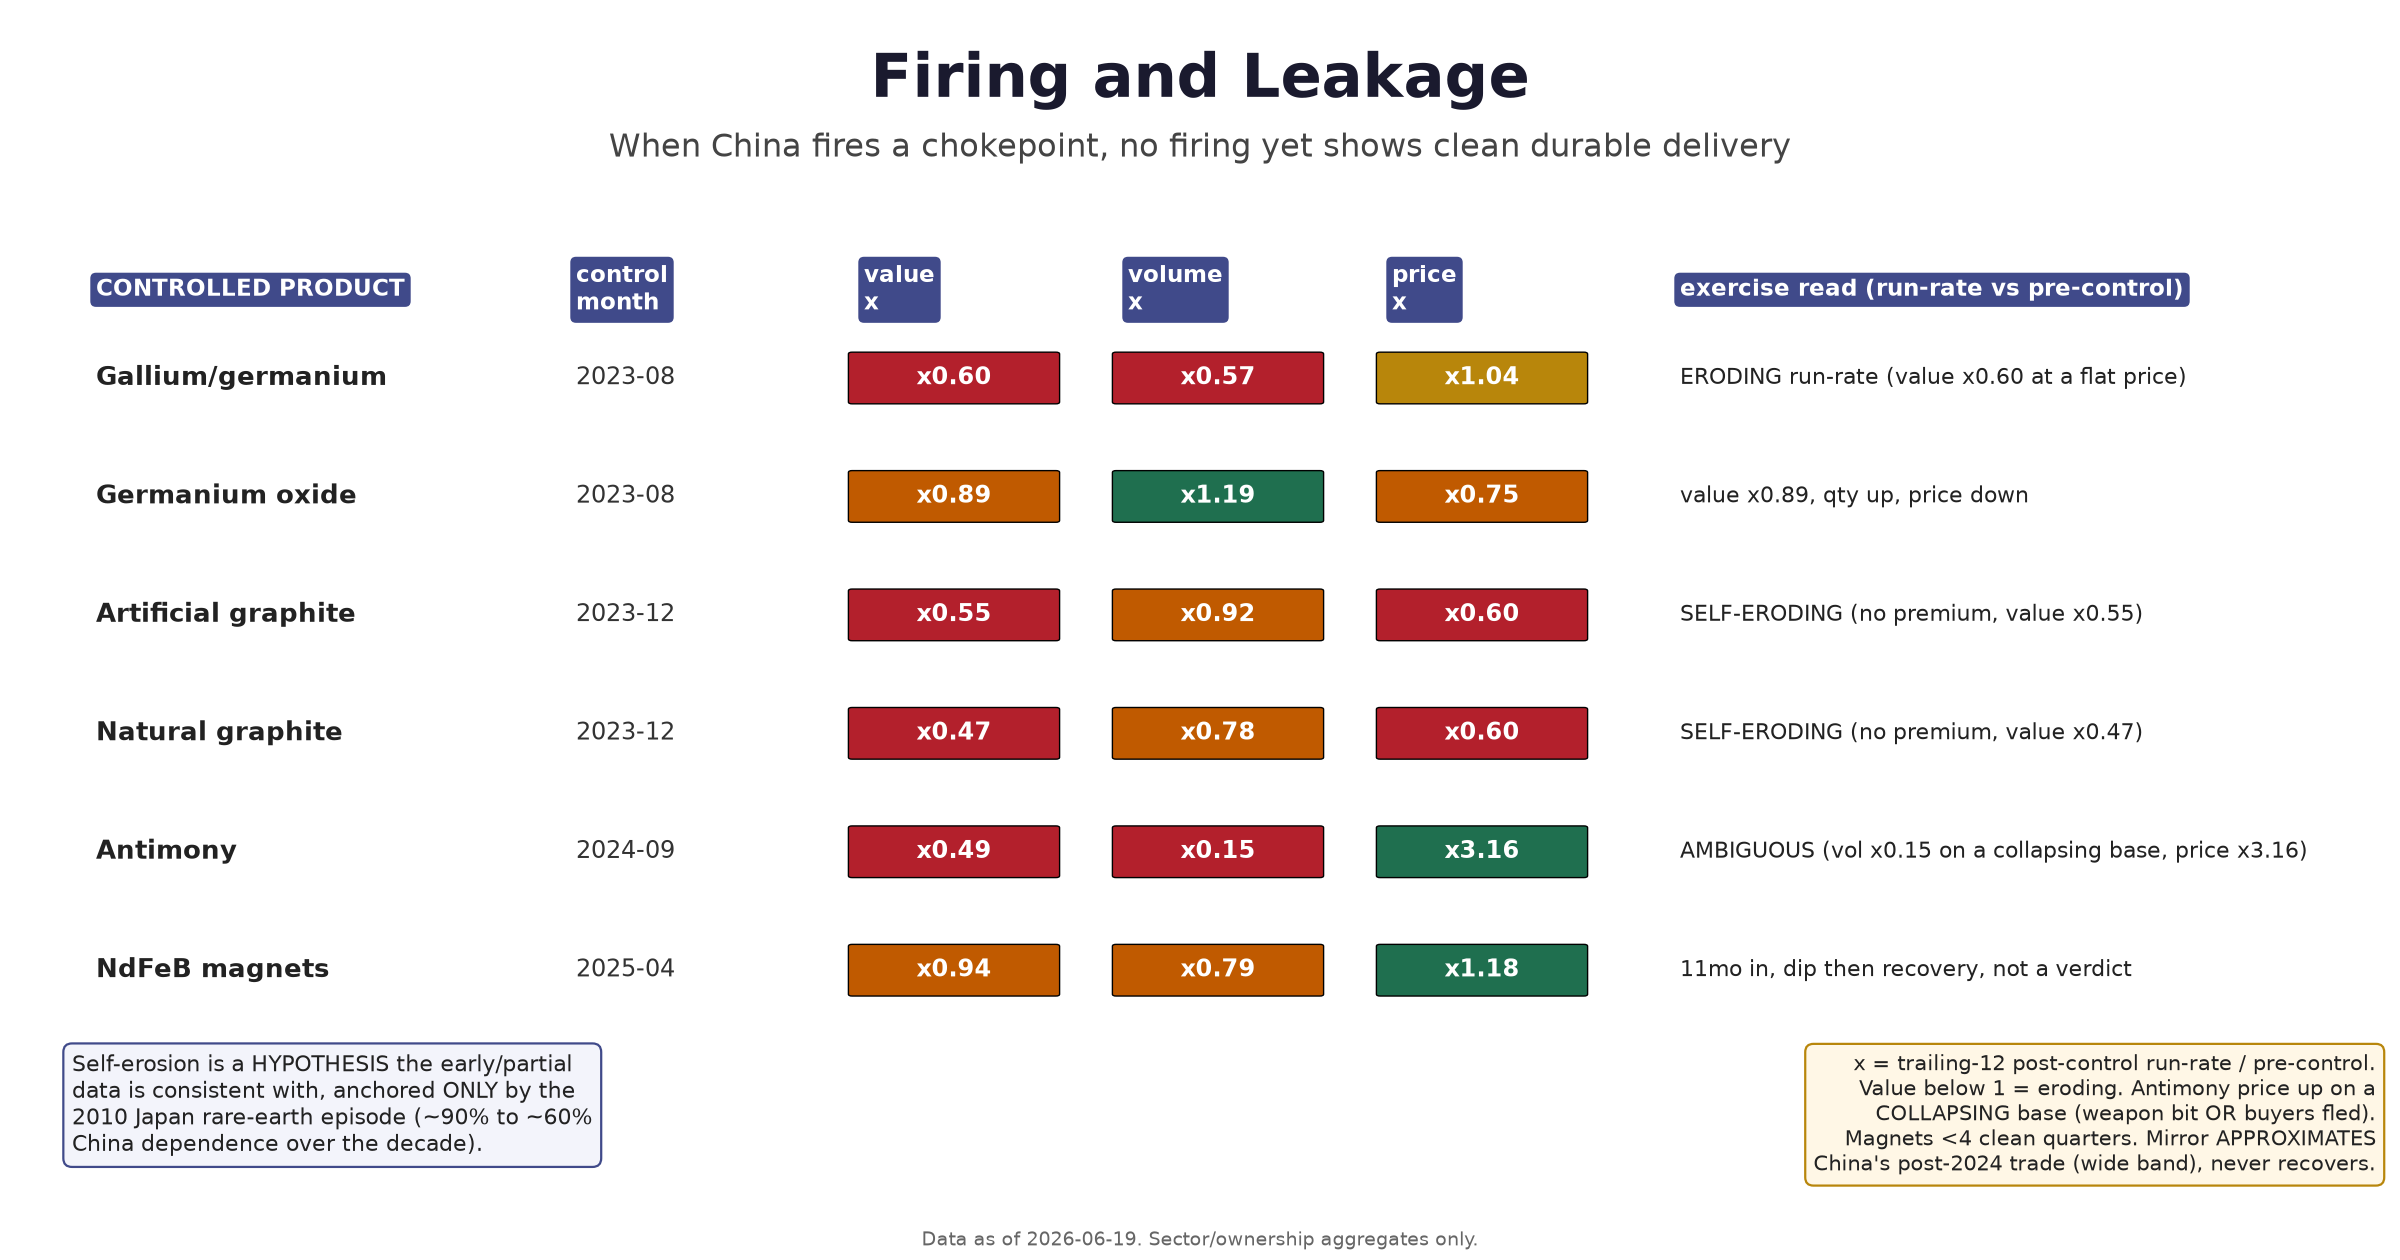
How to read it: each row is one fired export control; the multiples compare the trailing-twelve-month run-rate after the control against the twelve months before it, for value, volume, and price.
What to see: every value multiple sits at or below 1.0; no firing since 2023 shows sustained volume at a price premium, the signature durable delivery would leave.
Since 2023 Beijing has refired the weapon four more times, helpful for my analysis but not for anyone else. All four regimes are licensing systems, and all four remain in force today. They are not the ban you read about: the separate December 2024 outright ban on gallium, germanium, antimony, and superhard-material sales to the US is not part of this scorecard and is not currently in force, suspended in November 2025 until November 27, 2026 under the truce. The licensing regimes graded here never paused.
Gallium and germanium, licensed in August 2023, are the strongest case for Beijing, and even they are not a win. China’s share of reported world exports held around 37 percent. But the exercised flow eroded underneath the share: trailing-twelve-month export value ran at about 0.60 of pre-control across 31 months, at a roughly flat price. Share durability with a shrinking, unpriced flow is not delivered leverage.
Graphite, licensed from December 2023, is self-eroding. Natural graphite ran at about 0.47 of pre-control value with no price premium, artificial graphite similar. A control that cuts your flow without raising your price is not coercion. It is a subsidy to your competitors.
Antimony, licensed from September 2024, is the ambiguous one, and the ambiguity is structural. Volume collapsed to about 0.15 of pre-control while price rose about 3.2 times. That pattern can mean the weapon bit, or that buyers fled a collapsing base; price-up plus volume-down does not self-interpret. Two outside checks help. The United States Geological Survey (USGS) shows China still holding about 60 percent of world antimony production while its export share fell, a genuine withheld-exports signal. And rest-of-world antimony supply rose about 57 percent in the year after the control. The adaptation half of the story shows up at the buyers, in data China cannot black out.
Magnets, licensed April 2025, are eleven months in: a dip in May and June 2025, then recovery toward baseline, value around 0.94. That is fewer than four clean quarters and it is not a durability verdict in either direction. The bite was real; Ford idled a Chicago assembly line for a week in May 2025 for want of magnets. Whether the bite lasts is precisely what the 2027 data will answer.
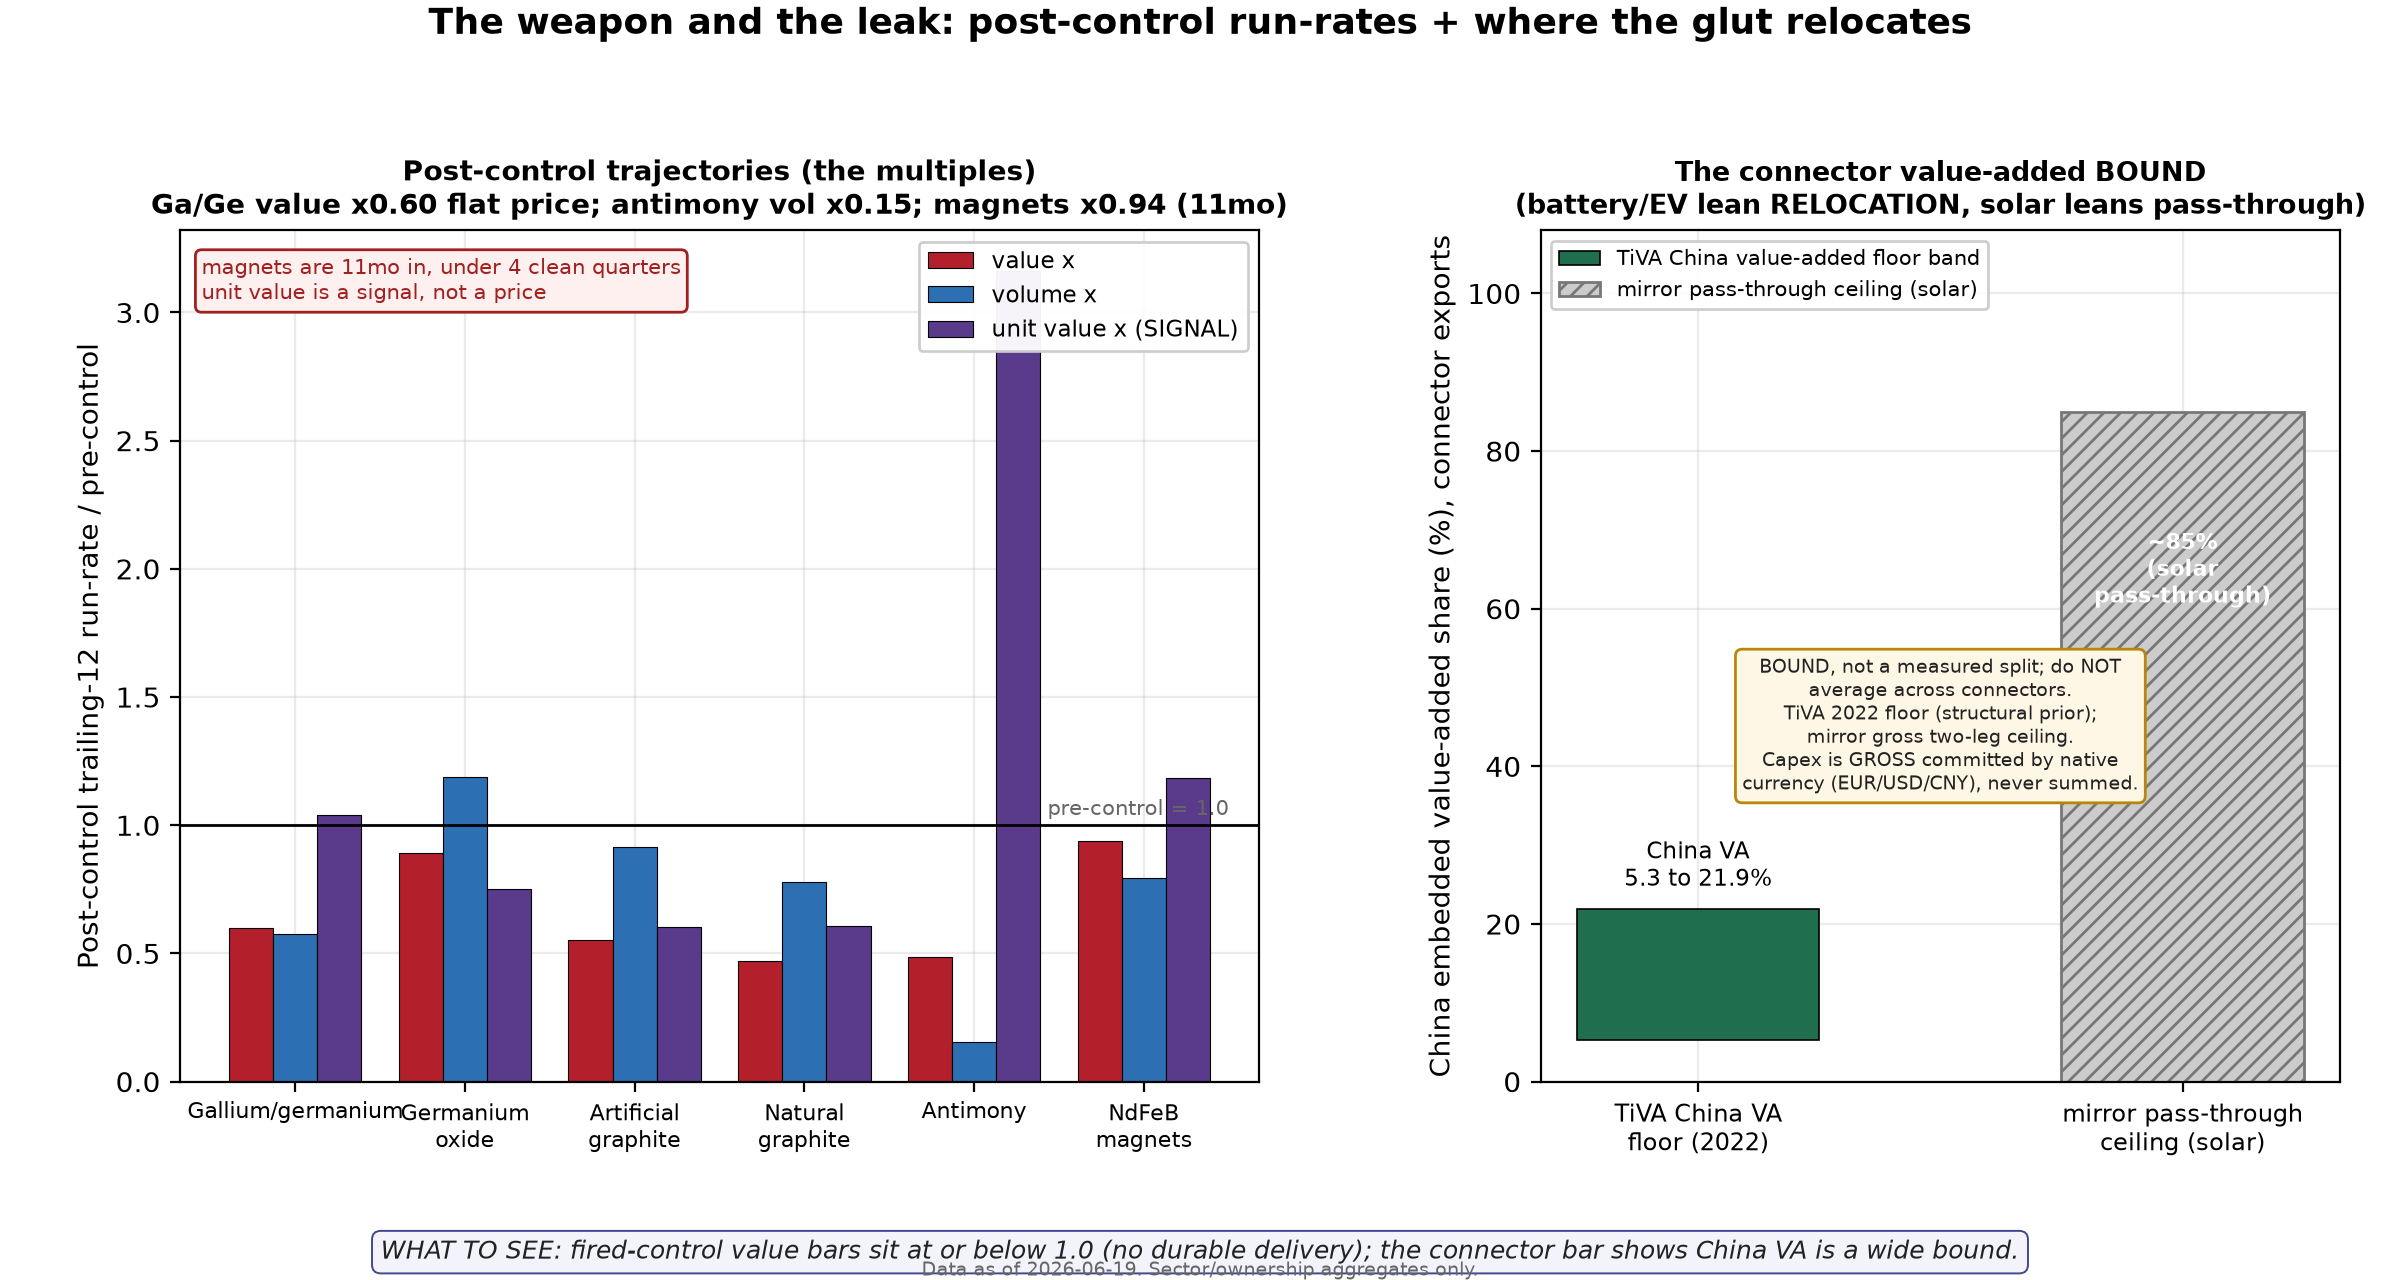
How to read it: left panel, post-control run-rate multiples by product, where 1.0 is the pre-control pace; right panel, the bound on how much Chinese value sits inside connector-country exports.
What to see: fired controls run at or below pre-control value everywhere; the connector bound is wide, which is why relocation gets graded by behavior, not by a point estimate.
4. Tariffs as economic warfare defenses was whack-a-mole. Export controls are China’s half of the exchange. The other half is what Western tariff walls do to China’s exported gluts, and the answer is not “stop them.” In 2024, roughly USD 5.5 billion of solar modules flowed out of Vietnam to the US and EU, built substantially on Chinese cells and Chinese-owned capacity. On April 21, 2025, Commerce finalized anti-dumping and countervailing duties (AD/CVD) on Cambodia, Malaysia, Thailand, and Vietnam at company rates from about 41 percent to over 3,500 percent. That route is now substantially closed. Within a year the flow respawned in India, Indonesia, and Laos, and the enforcement followed it: preliminary countervailing duties on February 24, 2026, preliminary anti-dumping on April 23, 2026, combined deposit rates roughly 100-234 percent.
Whack-a-mole is the right frame, and the moving mole is the point. Capacity that re-emerges one border over in under a year is relocation, not paperwork. Three markers say so. The solar cell-in to module-out ratios on the main routes collapsed from 2022 to 2024, Vietnam from about 0.081 to 0.008 and Thailand from about 0.260 to 0.008, which is rising local content, not rising pass-through. The disclosure trail agrees: cell and upstream plants abroad trigger billion-class board filings in their native currencies, while US module-assembly sites trigger no material filing at all. And the Chinese value embedded in connector exports is a bound, not a number: a 2-22 percent floor on 2022 input-output tables, with a mirror ceiling up to about 85 percent only on the transshipment-leaning solar lanes. Relocation and pass-through coexist, sorted by product; do not average them.
Europe runs the same play one act behind. About USD 4.0 billion of batteries flowed west out of Hungary in 2024, and Mexico’s EV flow to the same walled markets ran about USD 8.2 billion. The Hungarian route is open and producing, with the flagship battery and EV plants at Debrecen and Szeged reaching production start in early 2026, but it is newly contested: Hungary’s April 2026 election changed the government, the incoming coalition has pledged review of Chinese investments, and the EU’s revised investment-screening regime enters into force in summer 2026. The escalation ladder is more of a dance: what couples the two sides is imitation. When Washington writes an ownership rule, Beijing answers with an ownership rule; when one side reaches for extraterritorial licensing, the other copies the form within months. There is no tested tit-for-tat clock in this data. There is mirrored paperwork.
5. All of the economic warfare truces run out in fall 2026. The Busan framework of October 30, 2025 is a one-year truce, not a settlement, and its clocks are specific. China paused its October 9, 2025 rare-earth expansion, the five added elements and the extraterritorial rule reaching any foreign magnet with 0.1 percent Chinese-origin content, until November 10, 2026. It suspended the US-directed gallium, germanium, and antimony ban until November 27, 2026. Washington suspended the Bureau of Industry and Security (BIS) Affiliates Rule until November 9, 2026. Meanwhile the April 2025 licensing regime on seven rare earths was never suspended, and controlled rare-earth exports were still running about 50 percent below pre-control levels going into the May 2026 Beijing summit. The leaders meet again in the US in September 2026, weeks before all three alarms ring. It’s all right around the US mid-term elections and potential for a number of lame duck congress members and senators. And the yearly US continuing resolution season as political capital is expended on budgets.
Read Beijing’s posture against its own scorecard and it makes sense. A state that believed firing economic weapons was free would not holster this carefully. The 2025 magnet squeeze extracted real concessions, relaxed US positions on jet-engine parts, chip-design software, and ethane within about two months, and Beijing then sold the pause itself as a concession, twice. That is a threats-first doctrine: hold the inventory, fire briefly, monetize the fear, reholster before the erosion compounds. The Western counterpart obligation is just as specific. Each firing is a dated, free lesson in where dependence actually binds, and the truce year is the cheapest diversification runway anyone will be offered. Fall 2026 is the next scheduled lesson.
Best Arguments Against This
The strongest attack is the simplest: the exercise evidence is too recent, and China’s own trade data is missing after 2024. That attack is largely correct, and I concede the point. The mirror approximates China’s exports at the median; it never recovers them, and it cannot see the within-year license halt where the weapon actually bites. The 2010 arc is a sample of one. The magnet regime, the most strategically important firing, has eleven months of reconstructed data and could still print durable delivery in 2027. What survives the concession a weak claim that is strong enough to plan on: no export control China has actually used has ever paid off cleanly and kept paying.
The second-best attack: durability is the wrong test, because a weapon that hurts for two quarters can still coerce if the demand is small and fast. Also correct, and it is not a rebuttal. The 2025 squeeze got paid in concessions within two months, before any erosion mattered. That is exactly the held-beats-fired doctrine this post describes: the coercive yield front-loads, the depreciation compounds, and Beijing behaves accordingly.
What Would Change My Mind
The magnet window, readable in early-to-mid 2027: four clean post-control quarters showing sustained share and sustained volume at a price premium would kill the erosion hypothesis where it matters most.
China resuming its UN Comtrade reporting with a 2025 batch (on the 2024 cadence, that could land any time in the second half of 2026) whose real numbers materially diverge from the partner mirror. That would force this scorecard to be regraded.
Any fired control, on any product, holding share and volume at a premium through two full years. None has.
Firm-level value-added data showing connector exports are mostly pure transshipment. That would flip the relocation finding to pass-through and shrink the whack-a-mole story to a customs-fraud story.
A fall 2026 snap-back firing with no rest-of-world supply response within a year, against the antimony and graphite precedents. That would mean the adaptation machinery has stalled and fired leverage keeps more value than this record shows.
The close
China’s economic sector dominance charts are real, and they are the strongest the leverage will ever be. Every economic weapon firing converts a little more of it into someone else’s supply chain. If they truly fire all of their economic weapons then they will be out of economic ordinance within a few years. Beijing prices its weapon this way; the one-year pauses are the tell. Price it the same way, and spend the warning.
Next, Post 6: the West’s counter-target list, where the data says something uncomfortable. The deepest dependence is not the most feasible lever. Your target list is wrong.