
Every hacker learns this, usually the hard way. The most durable capabilities are the ones which never get logged. Here is the question that broke my economic-warfare ledger open. Which single Chinese policy quietly moved more profit than any subsidy line in a decade of audited filings? Not a grant program. Not a tax holiday. A capacity ceiling: a document that spends nothing and forbids something.
This post is about the instruments that decide outcomes in China’s economic-warfare machine, and why almost none of them cost the state money. The evidence comes from a decade of audited annual filings of listed Chinese firms, with the delisted casualties deliberately kept in the panel, pinned to dated policy documents.
Bottom Line Up Front
You will miss the weapons if you track Beijing’s economic arsenal by the money. The instruments that decided the outcomes in this dataset are administrative: capacity ceilings, export licenses, production quotas, ownership consolidation. They cost the state almost nothing to hold. Budget telemetry, the thing Western analysis is built to watch, misses every one of them.
The core evidence is a natural experiment that Beijing itself. In 2022 the state withdrew the same subsidy instrument, cheap industrial electricity, from two power-hungry sectors in the same year. Aluminum smelting, which sat under a hard capacity ceiling, came out ahead of its own-sector peers by 9.4 percentage points of net margin and 10.1 points of return on invested capital (ROIC), with zero delistings in the capped cohort. Solar, which had no ceiling, saw margins fall 5.4 points once the dead firms are counted, with three of the sector’s five listed-census casualties landing in the post-shock window. Same lever, same year. The cap separated the survivors from the corpses. The caveat sits here, not in a footnote: the contrast rests on five treated smelters, a strong directional result rather than a decimal-precision law.
The second pillar is the one economic chokepoint weapon China has actually fired: critical minerals. The measured subsidy cash to listed rare-earth firms over the decade is CNY 6.8 billion, roughly USD 0.9 billion, an intensity of 0.07 percent of revenue. A rounding error. The leverage that idled a Ford assembly line in 2025 rests on the 2021 quota consolidation, export licensing, and state ownership. The cash bought nothing. The paperwork bought everything.
And Beijing itself just confirmed the model. Watching solar bury itself, the state reached for the cap, not the checkbook: a capacity-retirement campaign, not a rescue subsidy. More on that below.
So the watch instruction for a policy audience is uncomfortable but simple. Track caps, licenses, and consolidation. The money is the loudest and least informative signal the system emits.
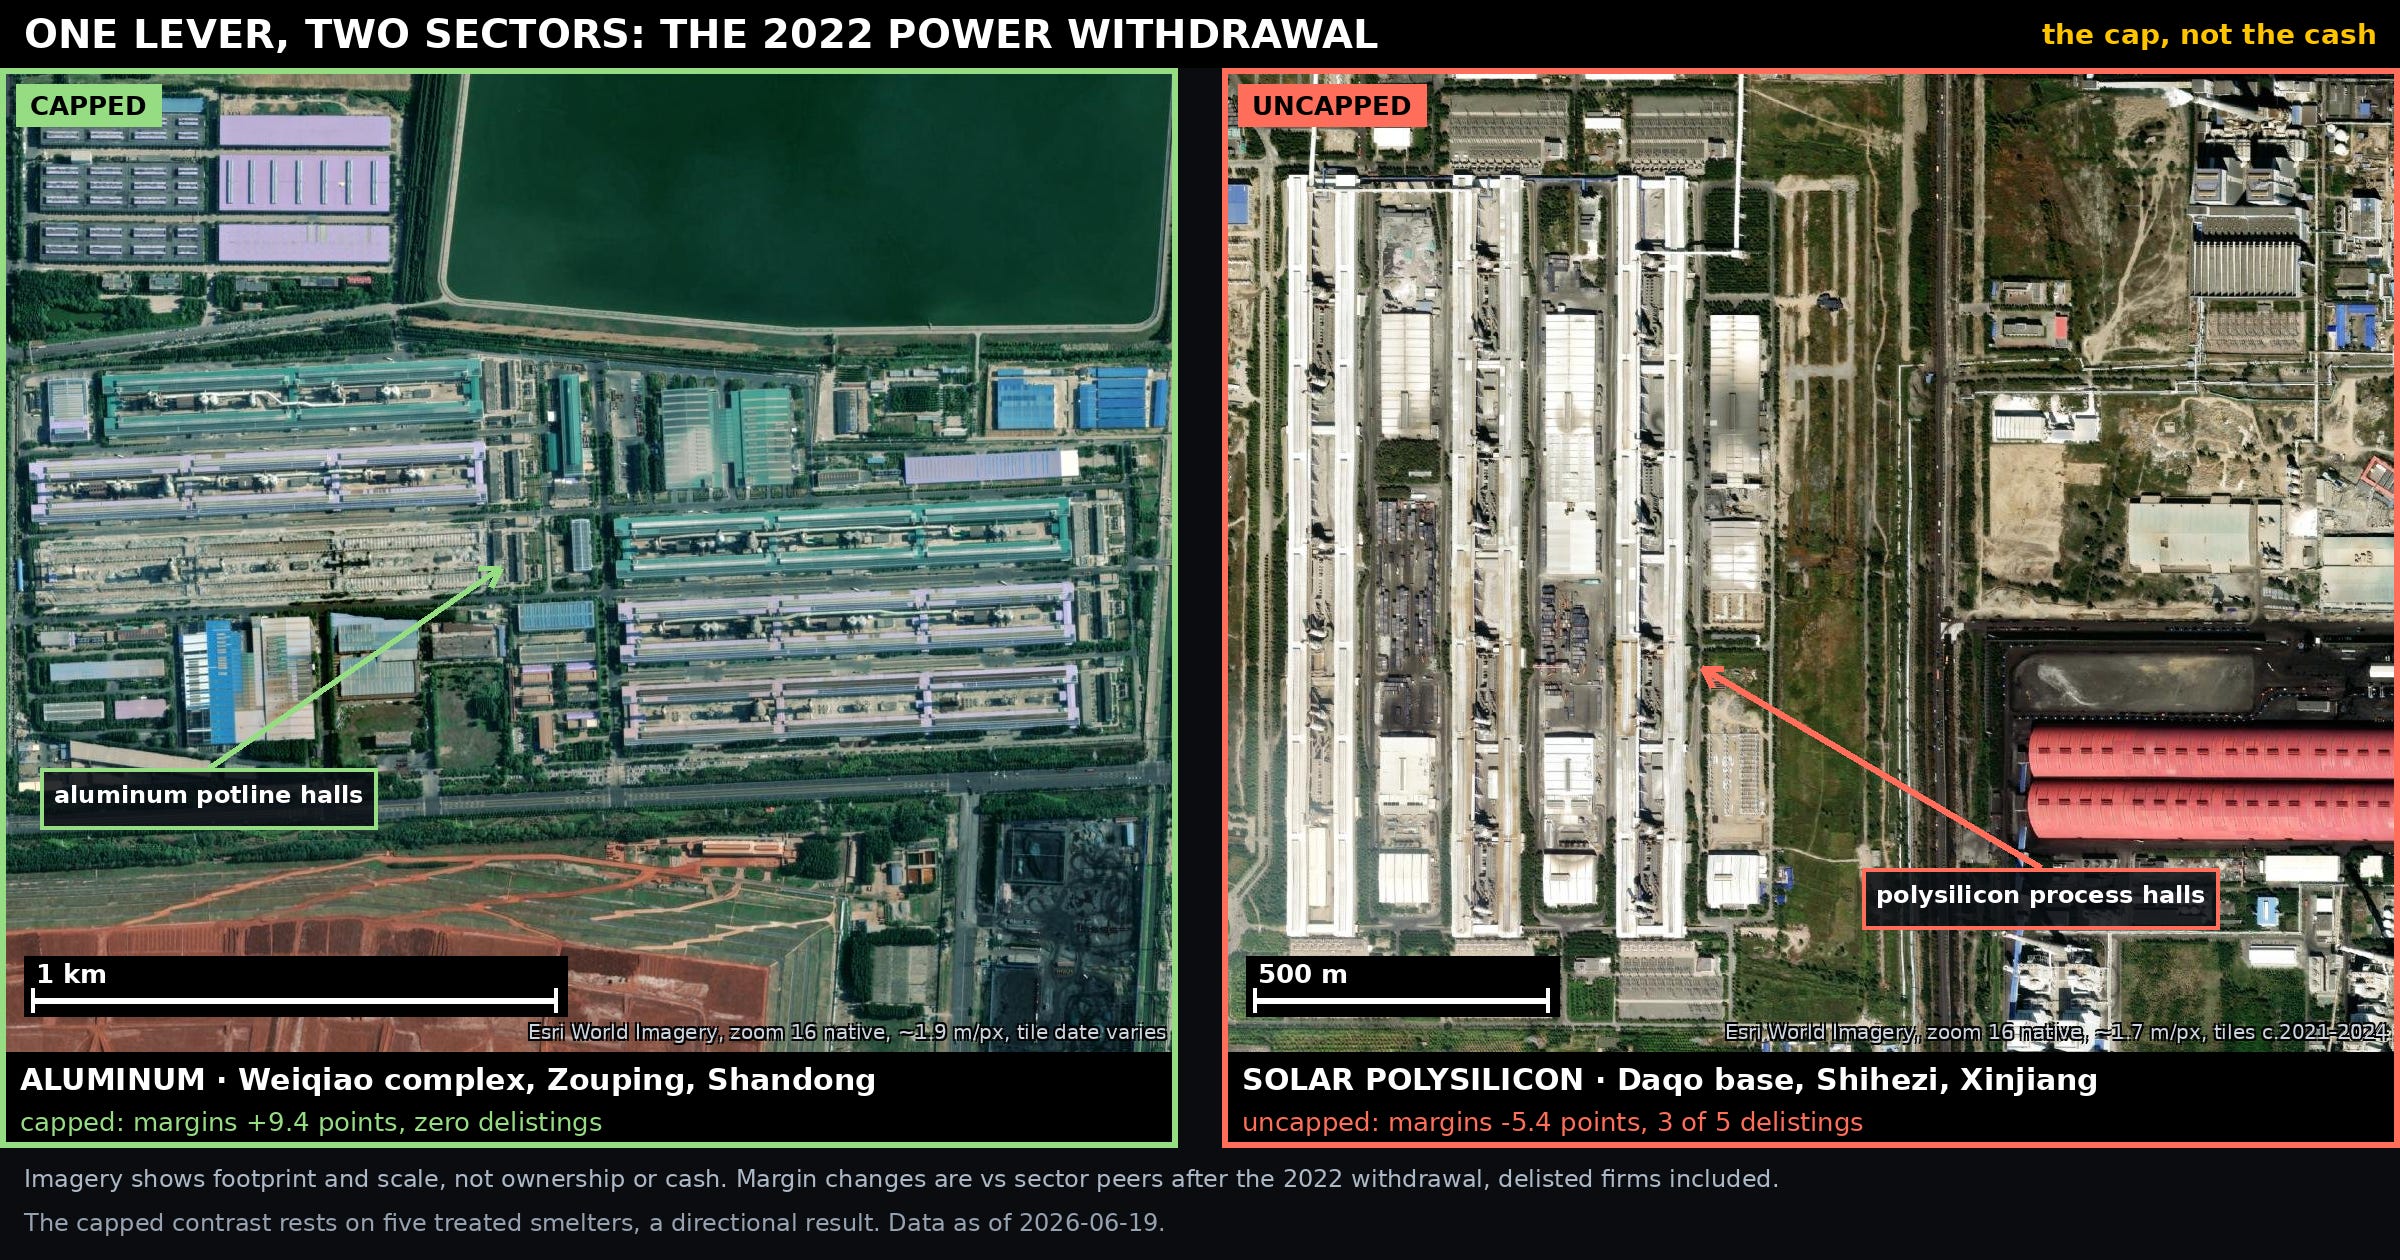
How to read it: two annotated overheads, the capped Weiqiao aluminum complex and the uncapped Daqo polysilicon base, with their post-withdrawal outcomes.
What to see: same lever, same year, opposite fates. The cap decided. Imagery shows footprint and scale, not ownership or cash.
1. Beijing ran the experiment for me
One lever, two sectors, opposite fates. In 2022 the Chinese state cancelled the preferential electricity pricing that had built two industries. Aluminum smelting lost its cheap power. Polysilicon, the raw feedstock at the top of the solar chain, lost its cheap power. Both sectors are essentially electricity converted into product. Both shocks trace to dated policy documents.
Two champions make the contrast concrete before any statistic. One polysilicon maker went from a 48.7 percent gross margin in 2022 to negative 16.6 percent by 2024, selling below the cost of making the material. One aluminum smelter posted a record net profit of about CNY 24.6 billion, roughly USD 3.4 billion, in the same window. Same shock. Opposite sign.
Now the measurement. The tool is a difference-in-differences (DiD) design: take the firms hit by the policy, take same-sector peers who were not, measure how each group changed across the event, and subtract. The subtraction removes the period’s general weather, because the peers lived through it too. The design’s honesty check is parallel pre-trends, meaning the two groups moved together before the shock. On margin and ROIC, they pass for both sectors.
Treated aluminum smelters beat their peers by 9.4 percentage points of net margin and 10.1 points of ROIC after the withdrawal. Read that again. The state removed a cost advantage from an industry whose entire cost structure is electricity, and the industry pulled ahead. Not a paradox. A supply story.
The difference was a ceiling. China had written a hard cap of roughly 45 million tonnes of annual smelting capacity into policy in 2017. When cheap power appeared, smelters could not respond the way commodity producers usually do, by building more and racing to the bottom. The cost increase passed through into the aluminum price, and the incumbents captured it. Solar had no ceiling. Its response to the same shock was more capacity into a glut: listed solar capacity rose about 326 percent across the window while the sector’s median net margin went from 12.3 percent to negative 9.5 percent.
Two disciplines on this claim, stated next to it. First, I report aluminum alone. Blend aluminum with steel into one heavy-industry cohort and the signal washes out to a meaningless 1.1 points, an artifact of mixing two experiments. Second, the attribution to the 2017 ceiling stays modest: studied as its own event, its margin interval touches zero on eight firms. The DiD carries the claim. The ceiling is the mechanism candidate, not a second proof.
The cap is not a relic of the past, either. China’s 2025 primary aluminum output came in at 45.02 million tonnes, a record, and essentially at the 2017 ceiling even without cheap electricity.
2. Bring out your dead
Survivorship bias would have hidden the entire harm. This is the finding I would teach first, because I caught it pretty late in the project.
Run the solar DiD on the firms that still exist and the withdrawal looks benign: survivors beat their peers by 2.4 points of margin. Positive. Fine. Now ask who is in that number. The survivors, by construction. A survivors-only panel quietly deletes the firms the policy may have killed. Put the casualties back in, coded to the year they died, and the solar margin effect turns negative, minus 0.7 points. Nothing changed except whether I counted the dead. The exact size of the flip depends on the control group, so I state the control set every time; the direction never changes. Counting the corpses always makes solar look worse.
The delisted-inclusive accounting of the full post-2022 window is the cleaner summary: solar net margins down 5.4 points, ROIC down 3.6, and three of the sector’s five listed-census delistings inside the four-year post window. The capped cohort’s count in the same window: zero. Not one capped smelter delisted.
Where did the uncapped glut go? Abroad. Export unit values, total value divided by quantity, are a signal and not a price; they blend product mix, quality, and price. On that signal, lithium-ion batteries recently sold at roughly 0.80 of the world-average unit value on exploding volume, and solar modules and coated steel show the same signature. That is dumping pressure as a warning light, not a measured below-cost margin. Finished electric vehicles are the one exception, volume up at a stable relative unit value near 0.81, genuine cost-quality competition, and they stay out of this bucket.
For a strategist the survivorship correction is not a statistics footnote. The weapon does not need every producer to live. It needs enough output to survive long enough to deny everyone else a return. The casualties are not missing data. They are friendly fire in an economic weapon intended to kill (foreign) companies.
3. The lever works in reverse
Cut capacity and margins rise, on command. If a ceiling turns a subsidy withdrawal into a margin recovery, then removing capacity outright should do the same thing more directly. It does, and China ran that experiment too.
The 2016 steel de-capacity campaign, 去产能, “remove production capacity,” was a dated, enforced reduction. Run as a DiD against a machinery-matched control, it raised steel net margins by about 4.64 percentage points, with an interval of 2.46 to 6.82 that excludes zero, and gross margins by about 7.29 points. The causal weight sits on the margin legs only; I label the estimate conservative because the pre-trend bias runs against the effect. Utilization corroborates from an independent source: ferrous capacity utilization rose from about 71.7 percent in 2016 to 78.0 percent by 2018.
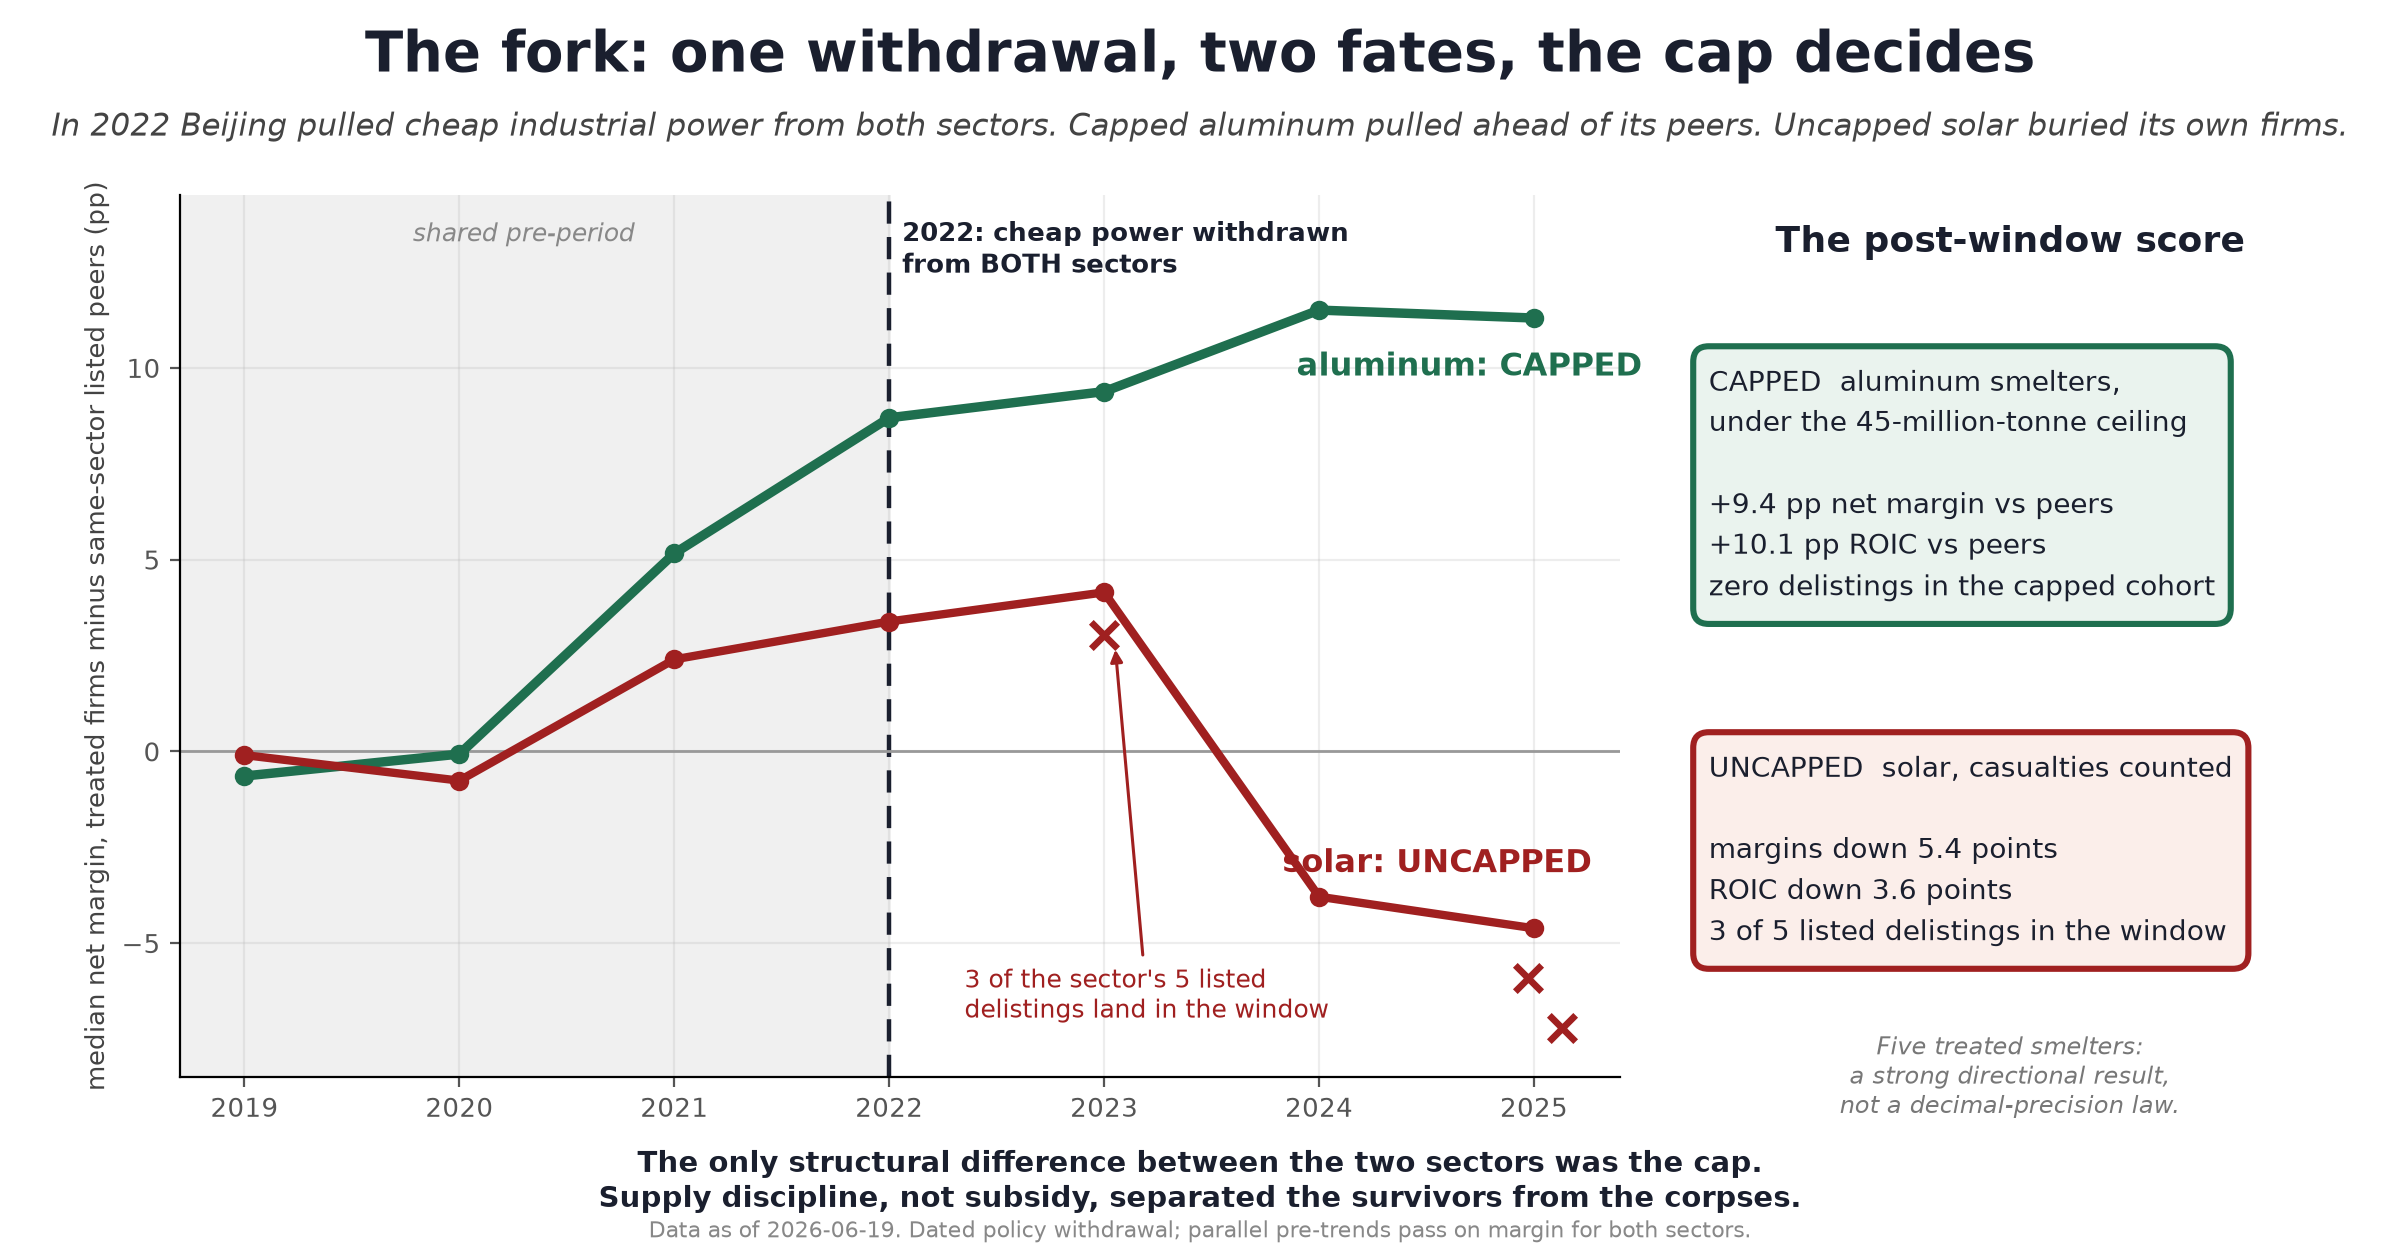
How to read it: real margin paths for the capped and uncapped cohorts around the 2022 power withdrawal, with the delistings marked on the falling branch.
What to see: one shared shock, a fork. Capped rises; uncapped falls with a body count.
The 2022 window supplies the negative control. Steel took the same power-price shock as aluminum but received no new supply discipline, and it walked into the property slump: minus 1.0 points of margin and minus 2.2 of ROIC against peers. The slump is a genuine confounder there, so I lean on steel only as the uncapped contrast, not as a second clean experiment.
State the claim precisely: supply discipline separated profitable survivors from casualty sectors under the observed 2016 and 2022 episodes. Cap forward, cut backward, same lever. Beijing can raise or lower an industry’s margins by adjusting how much of it is allowed to exist. No cash changes hands. Nothing shows up in a budget.
4. China’s only fired economic chokepoint runs on licenses, not cash
The rare-earth position was built with paperwork. Across this whole research project, critical minerals are the one place where China has repeatedly exercised chokepoint leverage against foreign targets, not merely held it. So look at what that leverage is made of.
It is not made of subsidy. The measured decade of cash to listed rare-earth firms is CNY 6.8 billion, about USD 0.9 billion, an intensity of 0.07 percent of revenue. For calibration, that is among the smallest sector figures in the dataset. The leverage rests on three administrative structures instead: production quotas, consolidated in 2021 into a handful of state groups; export licensing under the dual-use control regime; and state ownership of the consolidated groups. After the sector’s subsidy cash faded in the late 2010s, listed rare-earth margins actually rose, about 1.6 points, because the quota and license regime props pricing in a way cash never did. The state does not pay this sector to be a weapon. It permits it to be scarce.
The leverage is not hypothetical. China holds 67.3 percent of world rare-earth-magnet exports in the latest full reporting year, a reporting-countries-only figure that slightly overstates the share. When Beijing put seven medium and heavy rare earths under export licensing in April 2025, the queue for licenses idled Ford’s Explorer line in Chicago for a week within a month. At mid-2026, partner-reported trade data still had exports of the controlled elements running roughly 50 percent below pre-control levels, and that April regime stayed in force through every subsequent truce. The precedent cuts both ways, though: after the 2010 embargo episode, Japan cut its rare-earth dependence on China from roughly 90 percent to roughly 60 percent over the following decade. Fired leverage starts a diversification clock. Hold that thought for the next post.
Now the mirror, because it sharpens the lesson. Washington’s 2025 answer to this position was cash: an equity stake in its flagship rare-earth miner and a ten-year magnet-input price floor at USD 110 per kilogram, roughly double the miner’s 2024 realized price. A price floor is a rational answer to an adversary who can crash prices by adjusting a quota. But notice the asymmetry. The US instrument is budgetary, visible, and appropriated. The Chinese instrument is administrative, free, and invisible until the moment it binds. One side’s weapon shows up in telemetry. The other side’s does not.
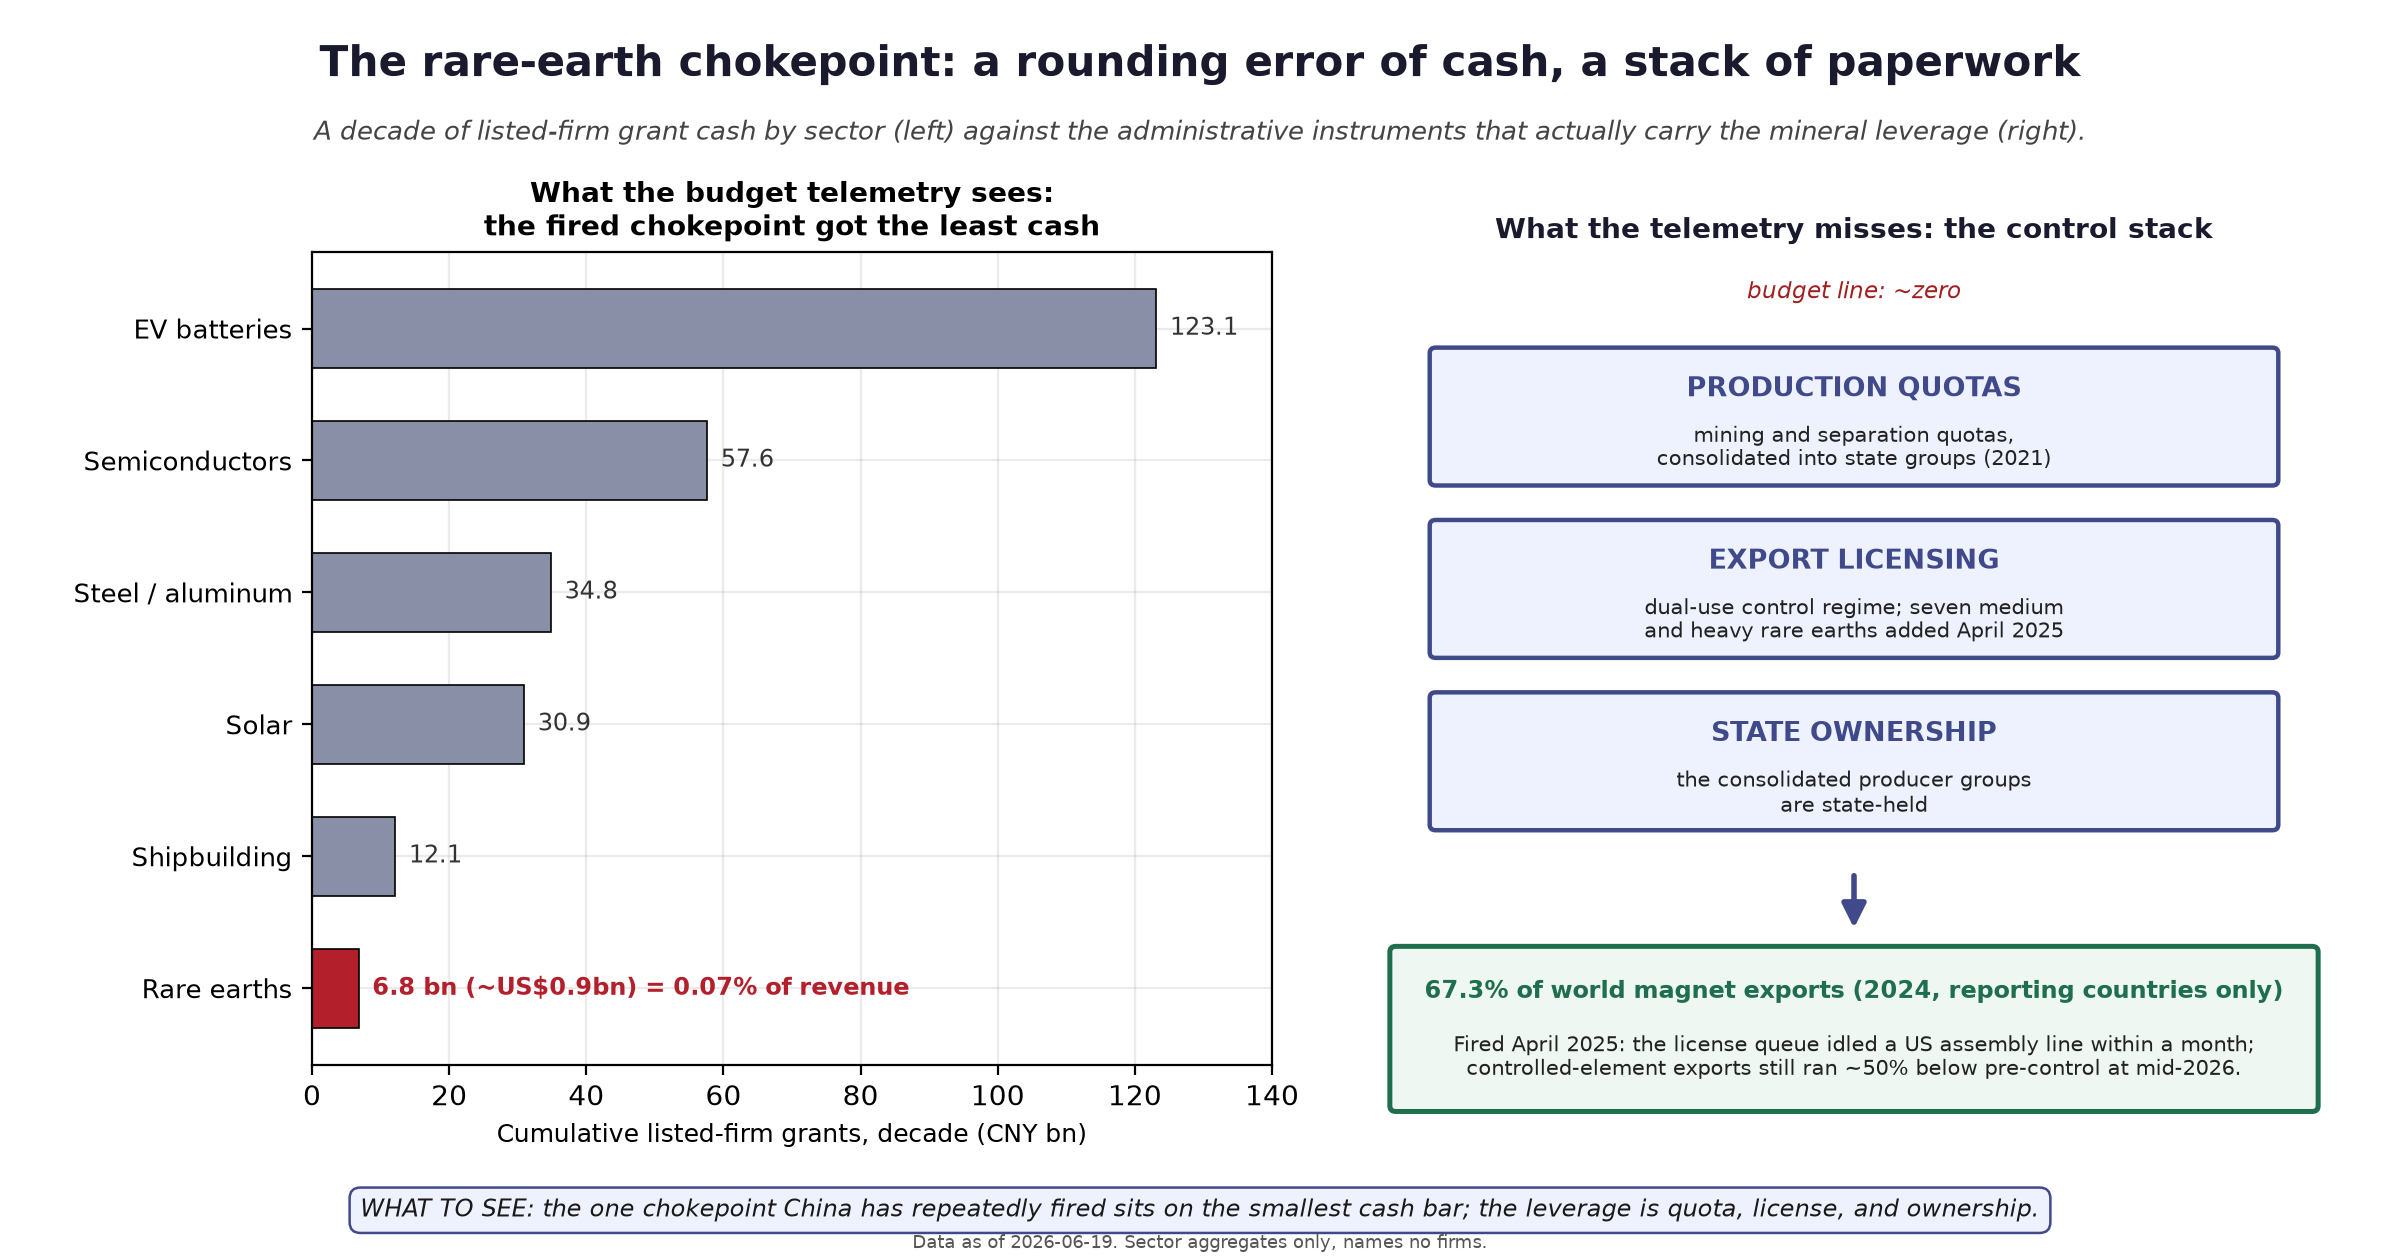
How to read it: the left bars are a decade of cumulative listed-firm grant cash by sector, with rare earths highlighted; the right stack is the quota, licensing, and ownership structure that actually carries the mineral leverage.
What to see: the one chokepoint China has repeatedly fired sits on the smallest cash bar in the panel; the leverage was built by permission, not payment.
5. Beijing reached for the cap, not the checkbook
The thesis is confirming itself in real time. Since mid-2025, Beijing has been trying to retrofit exactly this discipline onto its solar casualty. The “anti-involution” campaign against ruinous competition was elevated to a central policy priority in July 2025. The instrument set that followed is the tell: a proposed CNY 50 billion fund, about USD 7 billion, to retire over 1 million tonnes of the roughly 3.5 million tonne polysilicon capacity base; a December 2025 consolidation joint venture spanning six producers; and 2025 polysilicon output down 26.4 percent. Execution is visibly hard, and the antitrust regulator’s January 2026 warning complicated the cartel-style mechanics. But the direction is unambiguous. The state watched an uncapped sector bury itself for three years, held the checkbook it has used for decades, and reached for the cap instead. Beijing read its own experiment the same way I did.
That is the lesson compressed. A state that has learned the cap works holds a cheaper, quieter, more deniable toolkit. A rival that audits budgets will systematically underestimate it.
Best Arguments Against This
The strongest surviving counterargument: these are sector cycles, not supply discipline. Aluminum is a global commodity that had a good post-2022 run; solar was in a worldwide glut that punished producers everywhere; any cap-versus-no-cap story is riding coincidental cycles and calling itself causal.
The objection has real force, and two features of the design answer most of it. First, the DiD nets out sector weather by construction: treated firms are measured against same-sector peers living through the identical cycle. Second, the steel mirror breaks the coincidence reading. The 2016 cut and the 2022 withdrawal are different years, different cycle positions, and different lever directions, and the margin response follows the capacity discipline both times, up when capacity is cut, down when the field is open. One cycle can mimic one result. It is much harder for two cycles, six years apart, to mimic opposite results on cue.
What I concede: five treated smelters is a small cohort; the steel 2022 contrast carries a property-slump confounder; and the 2017 ceiling attribution is a mechanism candidate, not a proven cause. There is also a fair version of the objection I have not fully answered: caps only mint winners where earlier cash built the capacity, so the instruments are sequenced, not independent. True. The telemetry point survives it. The cash phase is loud and mostly over; the control phase is silent and current.
What Would Change My Mind
A capped sector that busts. If aluminum, sitting at its literal 45 million tonne ceiling, posts sector-wide negative margins with delistings in fiscal 2026-2027 filings absent a demand collapse, the cap thesis weakens badly.
An uncapped sector that shrugs. Any uncapped Chinese sector that absorbs a dated support withdrawal in 2026 or 2027 and holds peer-beating margins would be the counterexample this dataset lacks.
The anti-involution test fails. If the polysilicon retirement fund and consolidation land as designed and solar margins still have not recovered by fiscal 2027 filings, the cap lever is weaker than the steel and aluminum episodes suggest.
An input-cost decomposition of the smelter cohort showing the post-2022 gains came mostly from falling alumina and power costs, independent of the ceiling.
A firm-level transaction-price series showing batteries, solar modules, or coated steel selling at or above comparable world prices, which would retire the unit-value warning light.
The Close
A subsidy is a payment. A cap is a decision about who is allowed to exist. Payments show up in budgets, get counted by analysts, and buy capacity that anyone can also buy. Decisions about existence show up nowhere, cost nothing, and cannot be replicated by a treasury.
The money is not the weapon. The permission is.
Next in this series: what actually happens when Beijing fires one of these chokepoints, and why the record says a chokepoint is a wasting asset with a clock that starts at the shot.
"A subsidy is a payment. A cap is a decision about who is allowed to exist."
The subsidy provides resources. The cap defines what is admissible. One is functional: money flows, budgets report, analysts count. The other is structural: a document forbids, nothing flows, nothing shows up in telemetry. The functional is visible. The structural is invisible. The invisible instrument decided. The visible instrument was noise.
The West's entire measurement apparatus is built to track the functional. Budget telemetry, trade flows, subsidy counts, financial disclosures. The apparatus sees money. The apparatus does not see permission. Beijing's decisive instruments are permissions and prohibitions: capacity ceilings, export licenses, ownership consolidation, production quotas. None costs anything. None shows up in a budget. All of them decided which sectors survived and which buried themselves.
Survivors-only panel: solar withdrawal looks benign. Put the dead back in: solar withdrawal is catastrophic. Nothing changed except whether you counted the corpses. The dead carry the information the living hide. That is not a statistics footnote. That is a structural observation about what measurement hides by construction.
Most policy analysis asserts. This one specifies the conditions under which it would retract. That is what rigor looks like outside a laboratory.