
A buddy always read budgets as codification of priorities. Follow the money, find the priorities. So I ranked China’s six most strategic sectors by subsidy intensity, set that list next to the export chokepoints China actually holds, and waited for the two to line up. They lined up perfectly. Upside down.
That inversion is the subject of this post. It is also the quiet death of Washington’s favorite one-liner about China: “they subsidize their way to global dominance.” I spent a few weeks building the sector ledger that could test that line. The line fails. And the way it fails is more useful than the line ever was.
Bottom Line Up Front
Stop reading Beijing’s subsidy ledger as an ambition map. Read it as a fear map. Across the six strategic sectors I measured (solar, electric-vehicle (EV) batteries, rare-earth magnets, steel and aluminum, shipbuilding, and legacy semiconductors), the ranking is almost exactly inverted: the more intensely China subsidizes a sector, the less export leverage it holds there.
Semiconductors take the heaviest subsidy intensity of any sector, 7.3 percent of listed-firm revenue, plus roughly CNY 368 billion (about US$51 billion) in state equity. China remains the world’s largest chip importer, and its chip import bill rose from about US$250 billion to about US$413 billion over the decade of the buildout. The deepest one-way chokepoints China holds, cargo ships, coated steel, and rare-earth magnets, sit on the thinnest listed-firm cash in the panel. Six sectors is a pattern, not a law. But the pattern is consistent under every measure I tried, and it survives removing any single sector.
Here is what a decision-maker should now believe. Subsidy flows mark where Beijing feels exposed, not where it plans to dominate. Dominance formed where the product was exportable and the technology achievable, often on thin cash. The heavy cash sits where China is losing.
The caveats belong next to the claim, not in a footnote. The panel is six sectors. The mechanism is selection, not strategy; nobody in Beijing wrote “fund our failures” on a whiteboard. And shipbuilding’s near-zero measured intensity partly reflects support the listed ledger cannot see. All three get unpacked below.
The Findings
1. Rank the sectors both ways and the ladders cross. Subsidy intensity here means each listed firm’s disclosed state support as a share of its revenue, averaged across firms and years within the sector. Line the six sectors up by it: shipbuilding reads 0.0 percent (an artifact, fixed in finding three), rare-earth magnets 0.07, steel and aluminum 0.24, solar 1.4, EV batteries 4.0, semiconductors 7.3. Now line the same sectors up by one-way trade dependence, an asymmetry score built as rest-of-world dependence on China minus China’s dependence on the rest of the world, computed on each sector’s flagship product in 2024 trade data, reporting countries only: ships 99.9 (a thin-denominator artifact, also flagged below), coated steel 77.6, magnets 68.8, solar 59.2, batteries 52.9, chips minus 9.
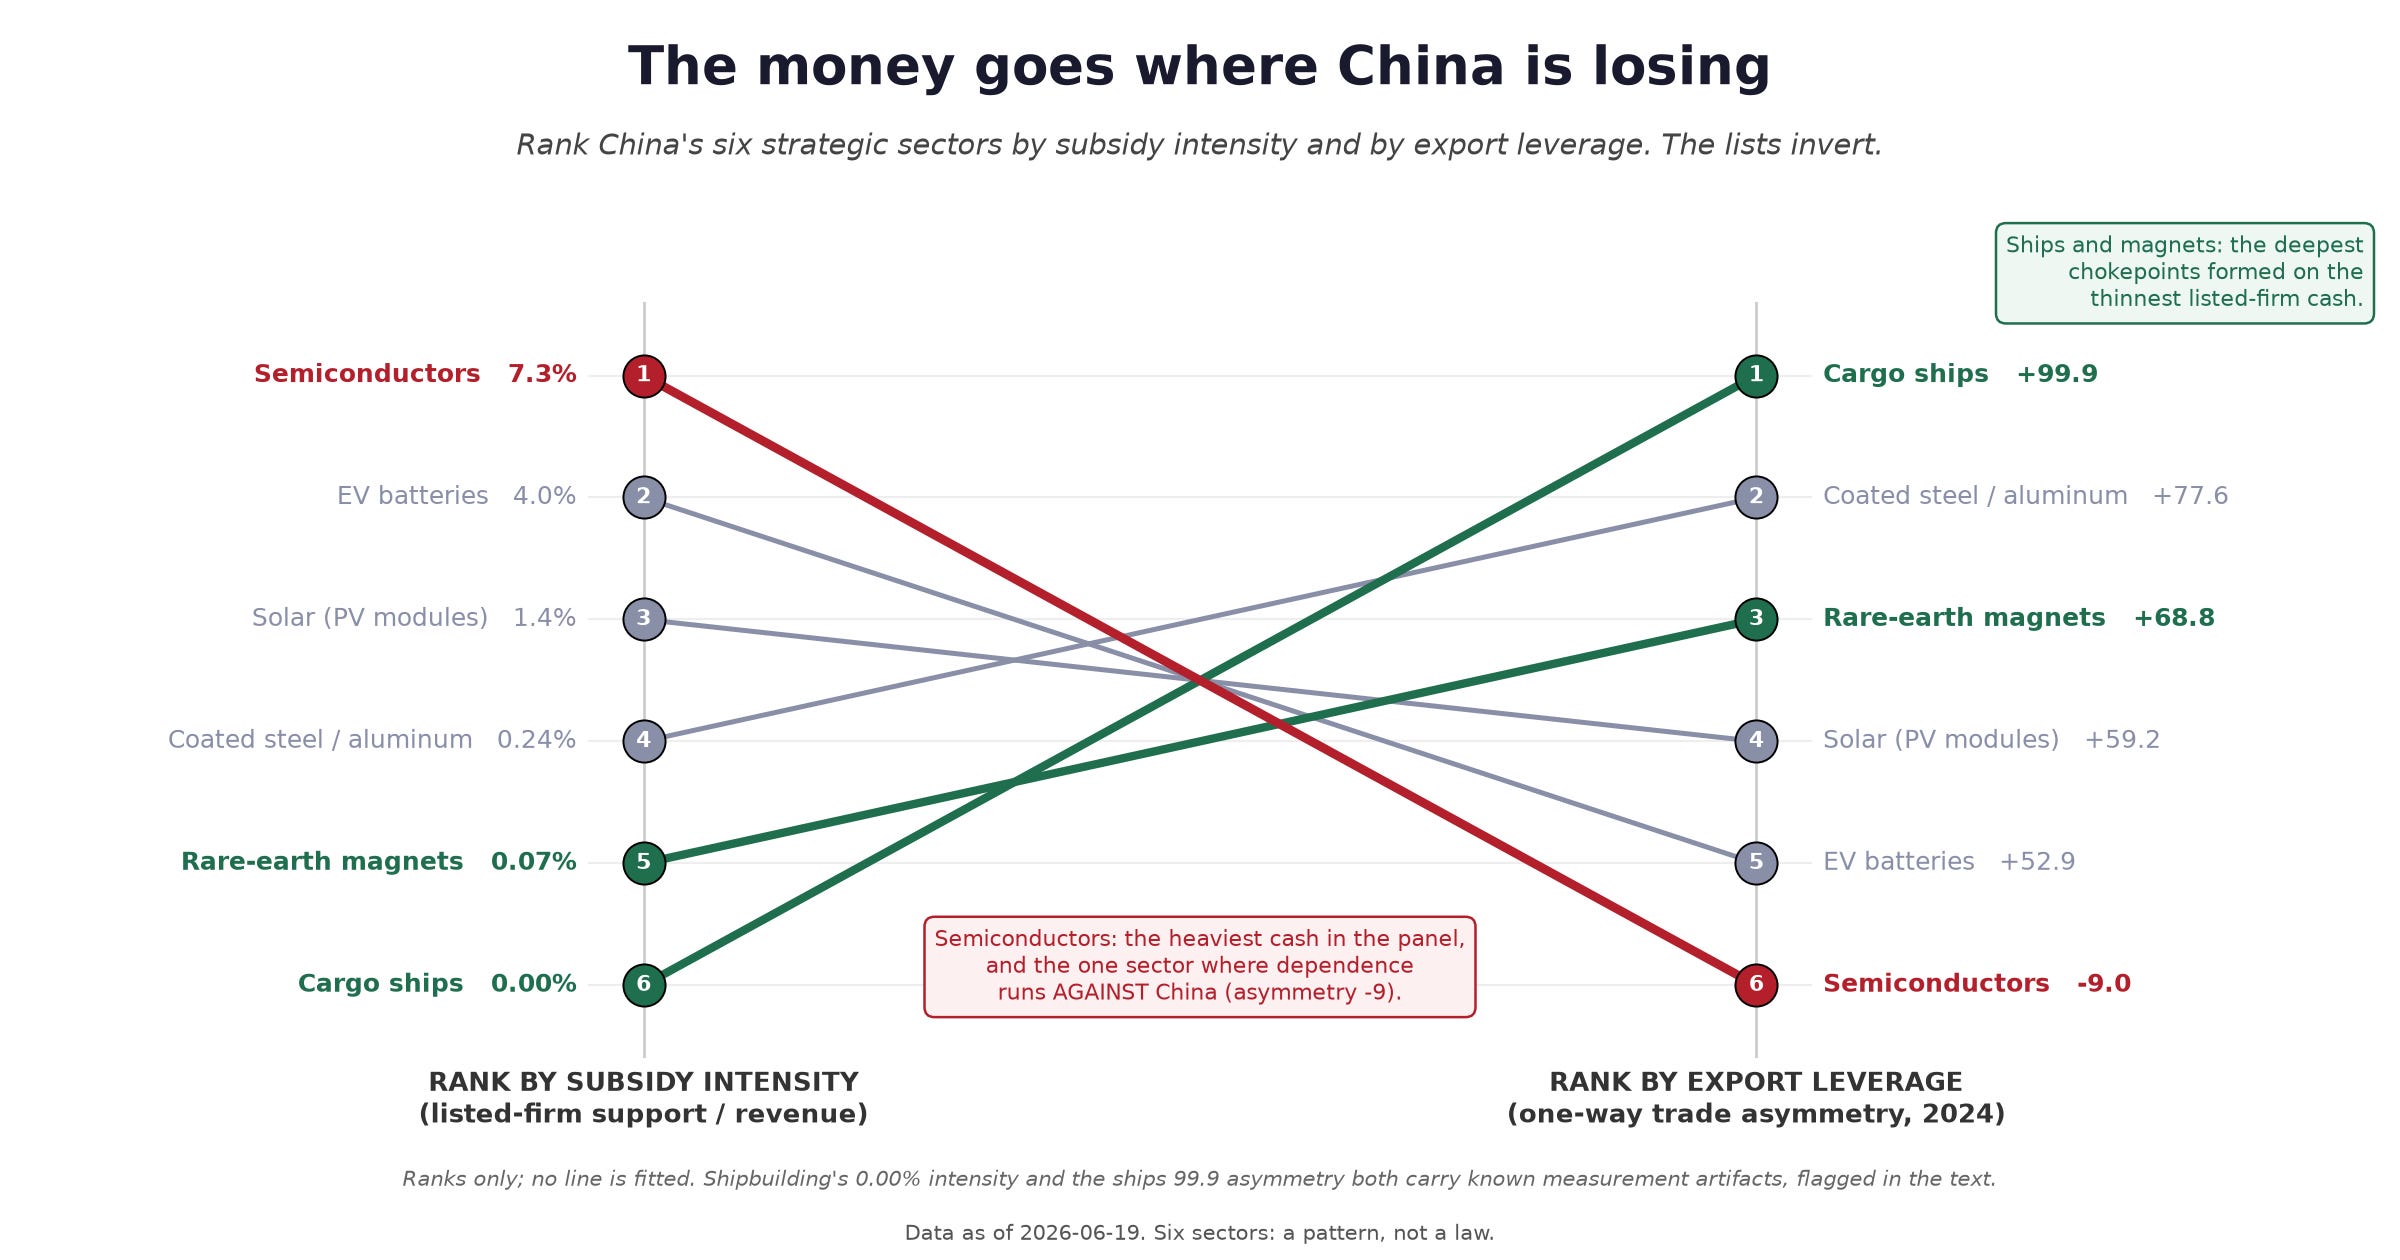
How to read it: each line is one of the six measured sectors, connecting its rank by listed-firm subsidy intensity (left) to its rank by one-way export leverage (right); these are ranks, and no line is fitted. What to see: the lines cross almost perfectly; the heaviest-subsidized sector, chips, lands last on leverage, and the deepest chokepoints climb from the bottom of the cash ranking.
The first ladder climbs. The second falls. Sector for sector, they cross.
If you want the one statistic, here it is, once: a rank correlation of -0.94 across the six sectors (exact permutation p = 0.017, computed on subsidy intensity versus trade-asymmetry rank; descriptive, not causal). Six sectors is a typology, not an estimated law. Remove any single sector and the inversion stands. Swap the measures, grant cash for intensity, world export share for asymmetry, and every pairing still comes out negative, though none of the alternates clears significance on its own. Six points cannot estimate a relationship. They can only exhibit a pattern.
2. The heaviest bet sits on the weakest position. Semiconductors absorb the heaviest firm-level support intensity in the panel, that 7.3 percent of revenue, plus roughly CNY 368 billion (about US$51 billion) of state equity through the national chip funds and their provincial siblings. The cash did not buy export leverage. China’s world export share in integrated circuits (ICs) runs 8 to 27 percent depending on the chip category, with the strongest slice, memory, at the top of the band. Chips are the only sector in the panel where the dependence runs against China: it is the world’s largest importer of them. The import bill did not shrink under the buildout. It rose, from about US$250 billion to about US$413 billion over the decade.
It is still rising. In January and February 2026, after more than three years of allied export controls, China imported 550 billion yuan (about US$76 billion) of ICs, up 36.8 percent year on year by value and 9 percent by volume. You will hear that China’s chip exports are surging too, up nearly 70 percent over the same months. They are, and they are overwhelmingly mature-node. The exports are the chips China can make. The imports are the ones it cannot.
One perimeter note, stated plainly: my intensity figure sees listed firms. Several of the biggest chip bets, the national memory champions and the tool builders, sit substantially off the listed books in state-held vehicles. Count them and the chip bet grows. The inversion deepens; it does not soften.
3. The chokepoints formed on thin cash. Now walk the other end of the ladder. On 2024 trade data, the latest full reporting year, China holds at least half of world exports in a set of products that includes photovoltaic (PV) modules at 71.5 percent, neodymium-iron-boron (NdFeB) magnets at 67.3, coated steel at 62.9, lithium-ion batteries at 55.0, and cargo vessels at 50.2. Those shares are computed from reporting countries only, so they run slightly high. They are still enormous.
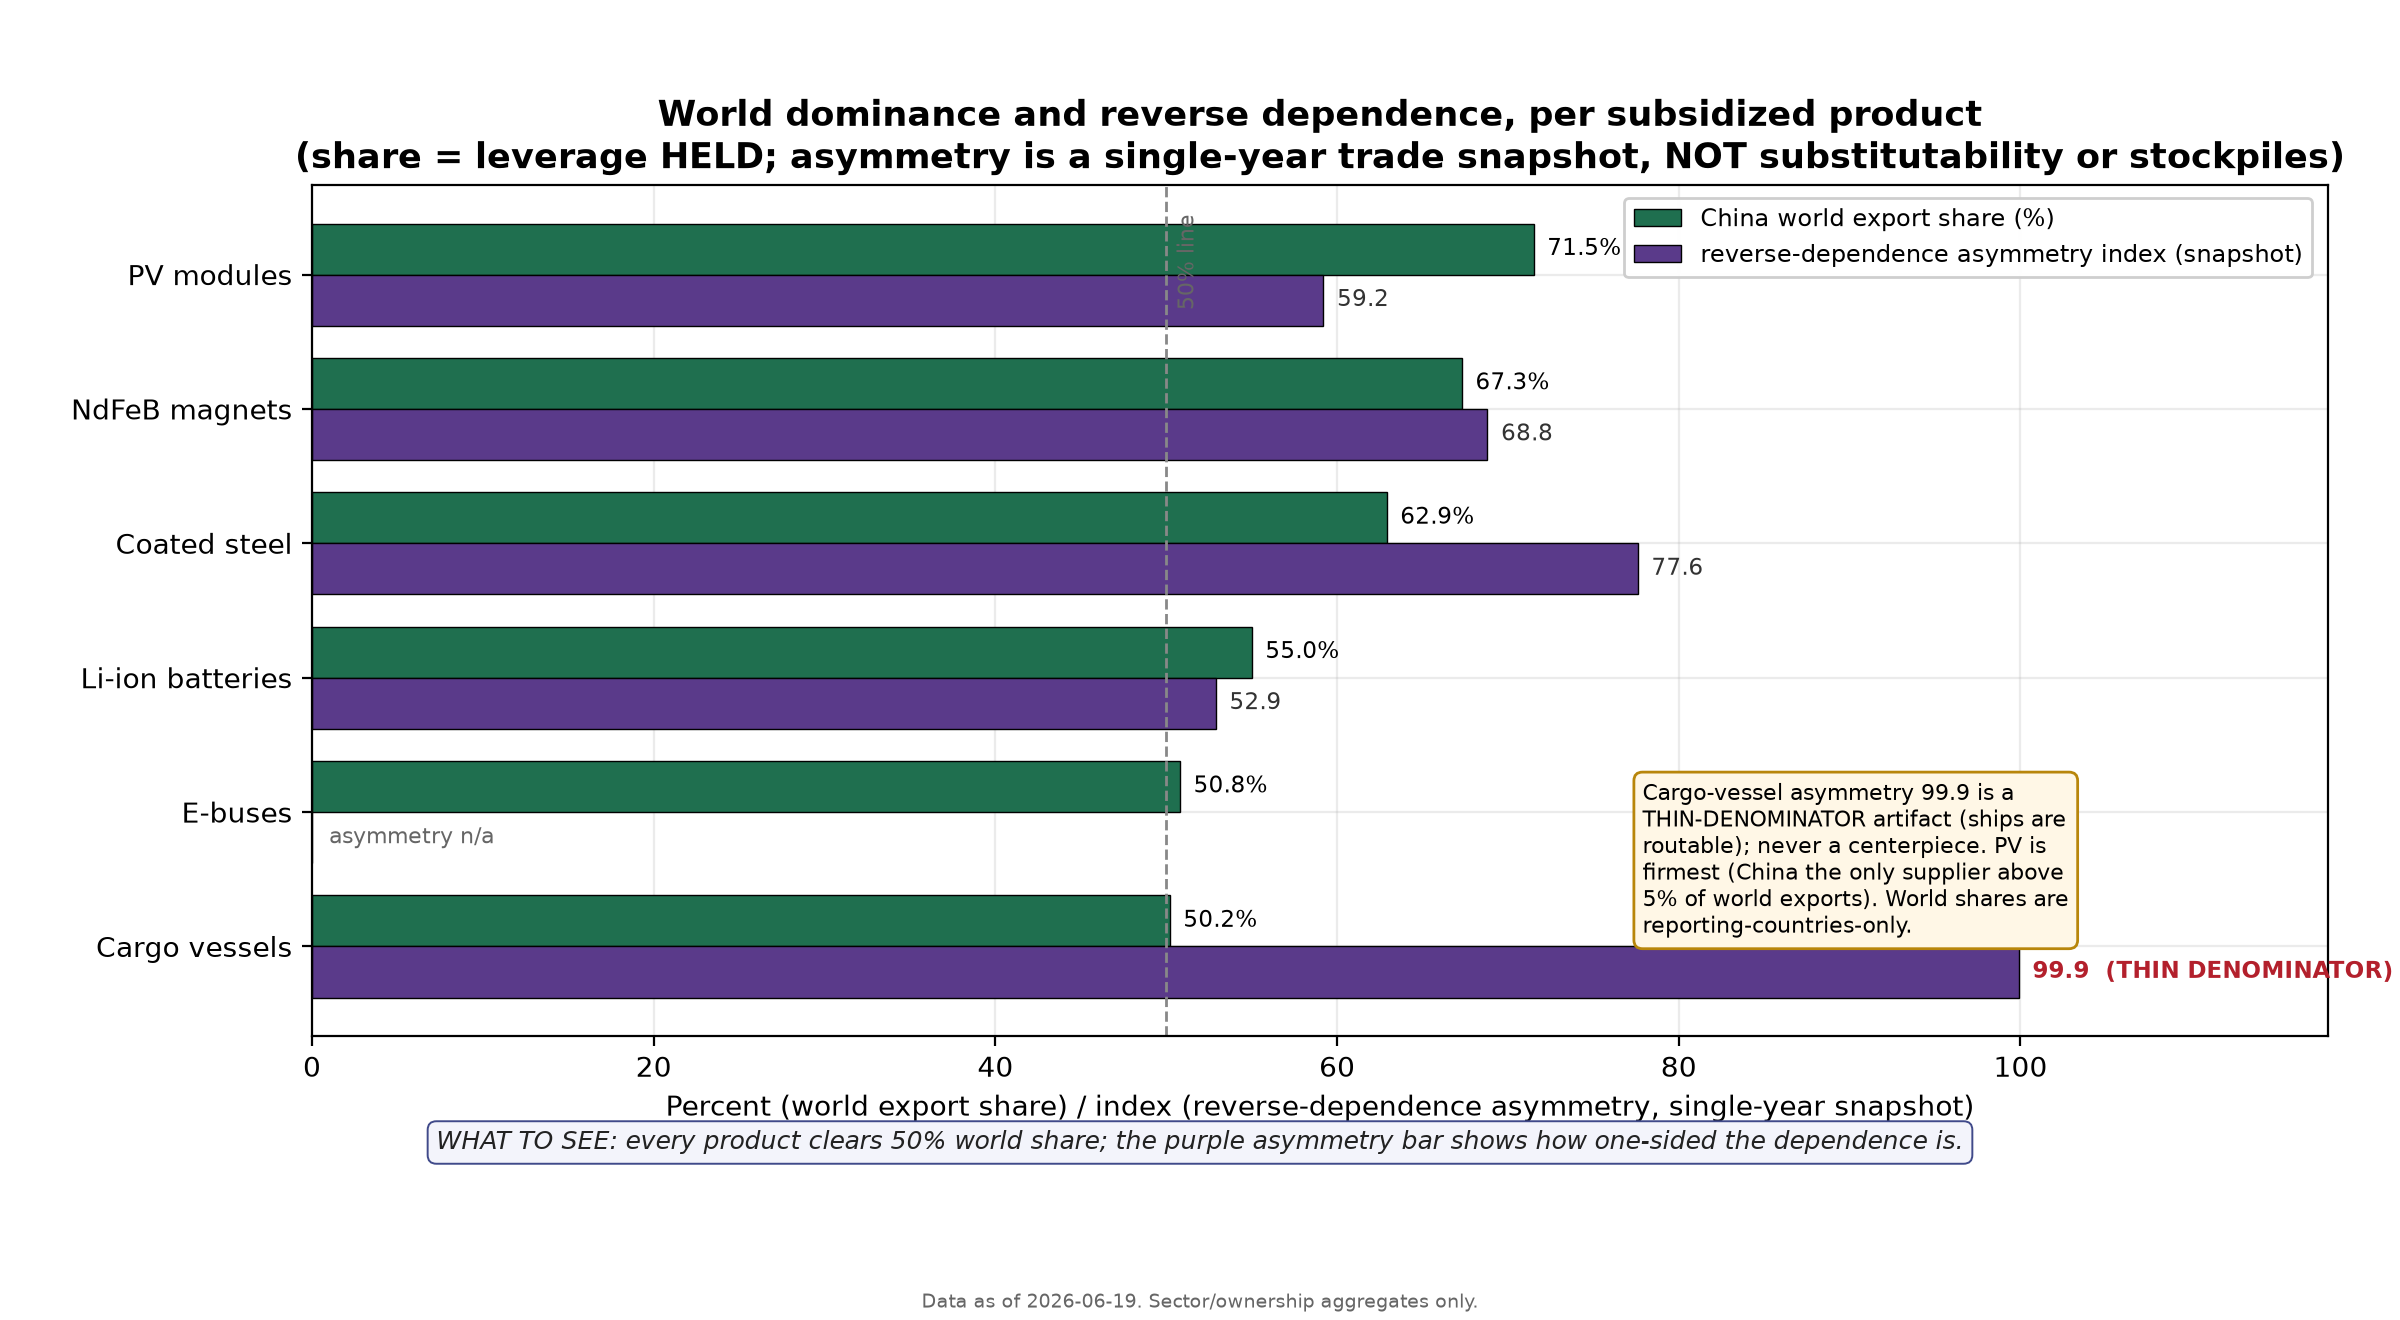
How to read it: green bars are China’s world export share per product (2024, reporting countries only, so slight over-estimates); purple bars are the one-way-dependence score for the same product (how much the world depends on China for it, minus how much China depends on the world). What to see: every product here clears half of world exports on thin sector cash; the cargo-vessel 99.9 is a thin-denominator artifact, flagged on the chart itself, because China barely imports ships.
Look at what built the deepest of those positions. The magnet chokepoint rests on about CNY 6.8 billion (under US$1 billion) of listed grants across a decade, an intensity of 0.07 percent of revenue. The instrument was structural: mining quotas, licensing, and a 2021 consolidation of the producers. Structure, not checks. Shipbuilding’s measured intensity literally reads zero, and that zero is an accounting artifact. The state’s support ran through the balance sheet, roughly CNY 210 billion (about US$29 billion) of cumulative support, mostly debt-to-equity recapitalizations that a flow-over-revenue metric cannot see. Heavy rescue, thin flow. Either way it is a fraction of the chip bet, and it sits beneath half of the world’s cargo-vessel exports. Coated steel holds 62.9 percent of world exports on 0.24 percent intensity.
One time-stamp so the headlines do not bite you: in January 2026 you may have read that China’s shipbuilding share fell for the first time in five years. That was share of new orders, roughly 63 percent for full-year 2025, dipping as Korea rebounded under US port-fee pressure. It is a different metric from the 2024 delivered-vessel export share printed here, and a useful reminder that held positions erode.
4. The inversion is selection, not strategy. Do not read finding one as “subsidies prevent dominance.” The mechanism is simpler and colder. The state pours money where the frontier is hard and the exposure hurts: chips above all. It spends lightly where dominance came cheap, from an achievable manufacturing base, or from resource position and quota, because dominance that comes from structure never needed a check. Where the product was exportable and the technology achievable, solar, batteries, ships, coated steel, capacity converted into world share, sometimes with cash helping. Where the frontier was hard, the same machine bought capacity, engineers, and a rising import bill instead.
So the think-tank chart that plots subsidy totals next to export dominance and draws an arrow is plotting a coincidence backwards. The cash did not buy the chokepoints. And the chokepoints did not need the cash.
5. The same ledger tracks China’s own vulnerabilities. There is independent corroboration for the fear-map read. Rank the six sectors by how exposed China itself is to inbound cutoffs, and subsidy intensity tracks that ranking positively, a rank correlation between 0.83 and 0.93 depending on the vulnerability measure. Same six sectors, same small-panel limits, and semiconductors do much of the work, so treat it as corroboration, not proof. But both rankings agree on the read: the cash flows toward the exposure.
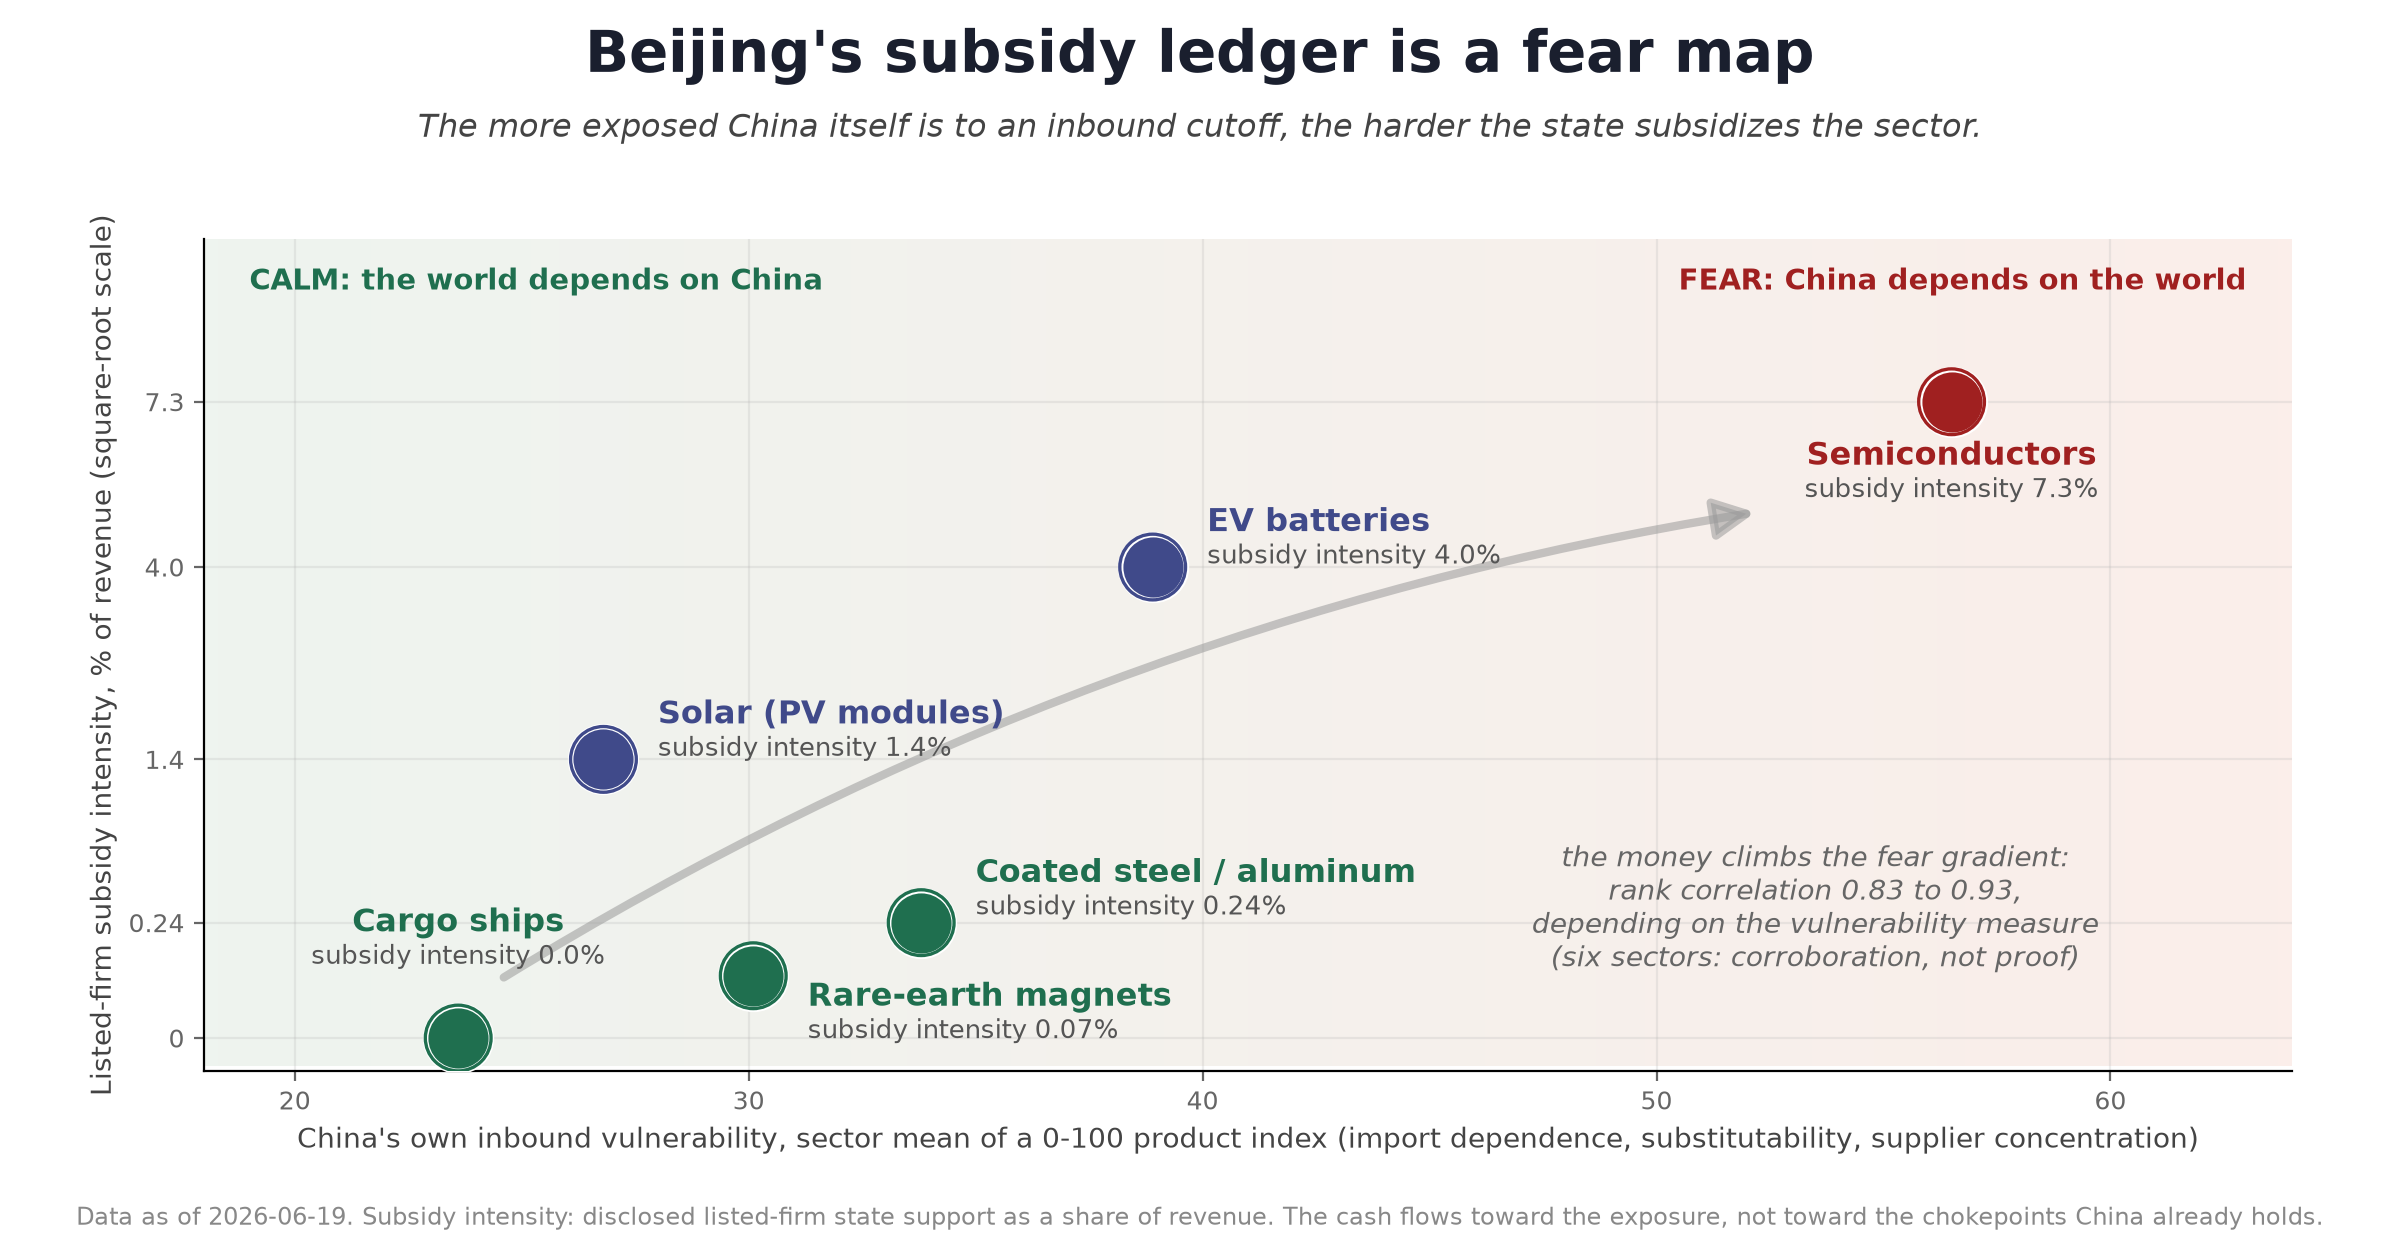
How to read it: each dot is a sector; the horizontal axis is China’s own inbound vulnerability, the vertical axis is listed-firm subsidy intensity. What to see: the money climbs the fear gradient. Corroboration, not proof.
That makes the ledger an intelligence product. If you want to know where Beijing believes it can be hurt, do not read its white papers. Rank its subsidy intensities. The allied chip controls that began in October 2022 landed on the exact sector the ledger marks as the deepest fear: 7.3 percent intensity, US$413 billion of imports. Washington read China’s chip push as an ambition and answered with a US$52.7 billion chip program of its own. The ledger says the push was always defense. Both readings end with chips mattering most. Only one of them predicts where the next yuan goes.
Best Arguments Against This
Three attacks survive contact, and the strongest deserves full volume.
The strongest: with six sectors, a determined skeptic can call the exact ranking luck. Six points is a coffee-table dataset, and the headline pairing was found by exploring the measured panel, not pre-registered. Both true. My response is not a better p-value; it is that the coefficient was never the load-bearing part. The per-sector facts carry the weight: the chip bet is the largest and chips are the import hole; the magnet chokepoint was built by quota and consolidation on trivial cash; ships were rescued through the balance sheet, not the income statement. Delete the statistic entirely and those three facts still invert the story.
Second: shipbuilding’s zero flatters the inversion. Correct. Restore shipbuilding’s equity support to the ranking and the inversion flattens but does not flip. The direction survives.
Third: the mid-ranking sectors cut the other way. Solar, at 1.4 percent intensity, holds 71.5 percent of world module exports; batteries, at 4.0 percent, hold 55.0. Heavy state cash and real dominance coexist there, and the cash plausibly helped build both positions. Also correct, and it bounds the claim. Money can help build dominance where the product is exportable and the technology achievable. What the ranking kills is the general law, subsidy in, dominance out. The heaviest money went where dominance never came.
What Would Change My Mind
Four triggers, dated and falsifiable.
China’s 2025 trade data lands on UN Comtrade (on the cadence of the 2024 batch, plausibly in the second half of 2026). If re-ranking on 2025 flows turns the chip asymmetry positive or flips the intensity-versus-leverage inversion, the fear-map read dies.
Four consecutive quarters of falling Chinese IC import value, checkable by mid-2027. That would mean the defensive bet is finally closing the exposure, and the “losing” in my title needs retiring. As of January and February 2026 the bill was growing 36.8 percent year on year, which is the wrong direction for this trigger.
Fiscal-2026 annual reports, filed by spring 2027, showing subsidy intensity surging into the held chokepoints, magnets or shipbuilding climbing toward battery-level intensity. Money chasing strength would break the inversion going forward.
A replication on a broader panel, ten sectors or more, in which intensity rises with export leverage. Six sectors exhibit a pattern; a bigger panel could overturn it.
The Close
A subsidy ledger is not a statement of ambition. It is a map of fear. China’s map is specific: the state is calm about the sectors where the world depends on China, and frightened about the one where China depends on the world. Read the ledger the way a poker player reads a nervous bet. The money is not the plan. The money is the tell.
Next in the series: follow the money down to the firms and ask what it buys where it lands. The answer is not excellence. It is refusal to die.