
I used to live on Bull Run Creek just upstream from the famous American Civil War battlefield. I taught my kids to fish on that creek. It’s the same creek that on the afternoon of July 21, 1861, congressmen rode out from Washington with picnic baskets to watch the war start and end. By evening they were racing a fleeing army back to the capital. The Union force that broke that day had lost 8.3% of its men. Where did the other 91.7% go? We’ll use Bull Run and a few other well studied battles to simulate the characteristics of AI weaponry on battle.
The mental model most people carry from war movies is attrition: two armies grind each other down, and the one that runs out of soldiers loses. That perception is wrong for most of military history. Battles do not usually end when an army is destroyed. They end when its will breaks, and the will breaks early.
At the First Bull Run the Union army came apart after 2,896 casualties, killed, wounded, missing, and captured, out of 35,000 men present. Divide it yourself: 2,896 / 35,000 = 0.083. Eight point three percent. That figure is a historical datum, not a model estimate, so no confidence interval applies; the honest fine print is that roughly 45% of the numerator was captured or missing rather than shot, and the denominator counts men present, not the smaller number actually engaged. On an engaged basis the fraction runs higher. The point survives either accounting: over nine-tenths of the army was standing when it stopped being an army.
So I built the breaking point into the math. A Lanchester attrition simulator where every unit carries an explicit morale threshold, validated against four real battles: Iwo Jima, First Bull Run, Pickett’s Charge, and Trafalgar. Then I asked the question the whole series hangs on: what happens when one side’s threshold is removed, because we can model a soldier as an AI tactical weapons platform that does not panic, and we can model a canon or a ship as a strategic weapons platform that does not panic?
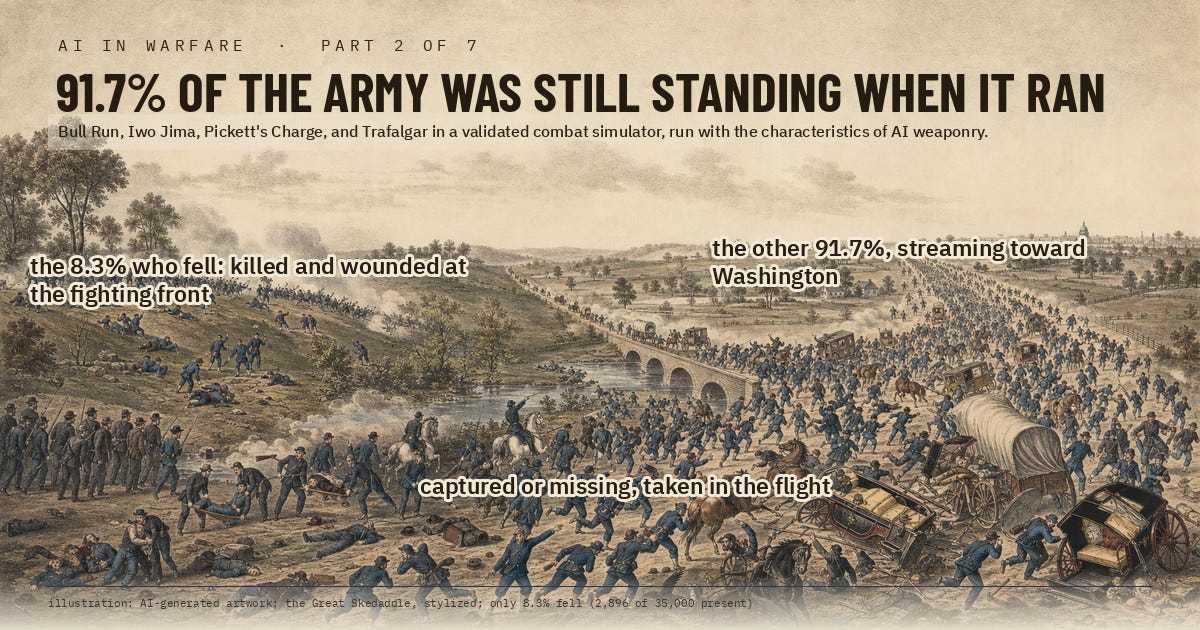
How to read it: wounded carried at the left, prisoners under guard, and the flood of unhurt men pouring toward a tiny Capitol.
What to see: the day ended in flight, not slaughter; most of the army walked away.
The visualization: First Bull Run, the rout that an unbreakable will turns into a stalemate.
How to read it: the left is history, the Union line breaks and routs toward Washington; the right is the same fight given an unbreakable will. What to see: the will stops the collapse but does not win. It grinds the rout into a bloody stalemate and raises Union losses from 8.3% to 12.5%.
What happens in the simulator? Pickett’s Charge succeeds 4.2% of the time in the baseline model (95% CI 3.9–4.6%, n = 15,000 runs). If you model the battle as if the Confederate assault was comprise of equivalent AI weapons with an unbreakable will then the assault wins 92% of the time (95% CI 91.6–92.5%). The rest are stalemates at nightfall; the AI-equivalent assault never loses outright. The caveat sits right here: these are attrition-model results with literature-calibrated breakpoints, not a spatial recreation of the battlefield, and the same experiment run on the other three battles shows the flip is the exception, not the rule.
And one of the four battles is not a counterfactual at all. Iwo Jima’s garrison actually fought without a breakpoint. In the model, that real unbreakable will roughly doubled American casualties and more than tripled the battle’s length.
The findings
1. The Union army broke nearly intact. Bull Run was the first major land battle of the Civil War, fought July 21, 1861, with spectators. McDowell’s 28,450 engaged Union troops faced 32,230 Confederates once Johnston’s army arrived by rail, so there was no Union numerical edge at the point of decision. Late in the day the Union withdrawal dissolved into a panicked flight toward Washington, entangled with the picnicking civilians, an episode the press made famous as the Great Skedaddle. The casualty ledger tells you what actually happened. Union losses: about 460 killed, 1,124 wounded, 1,312 missing or captured. Confederate losses: 387 killed, 1,582 wounded, and 13 missing or captured. Thirteen. That asymmetry, 1,312 against 13, is the signature of a one-sided rout. Both sides bled at similar rates while they fought. Then one side stopped fighting, and men who would have been shooters became prisoners.
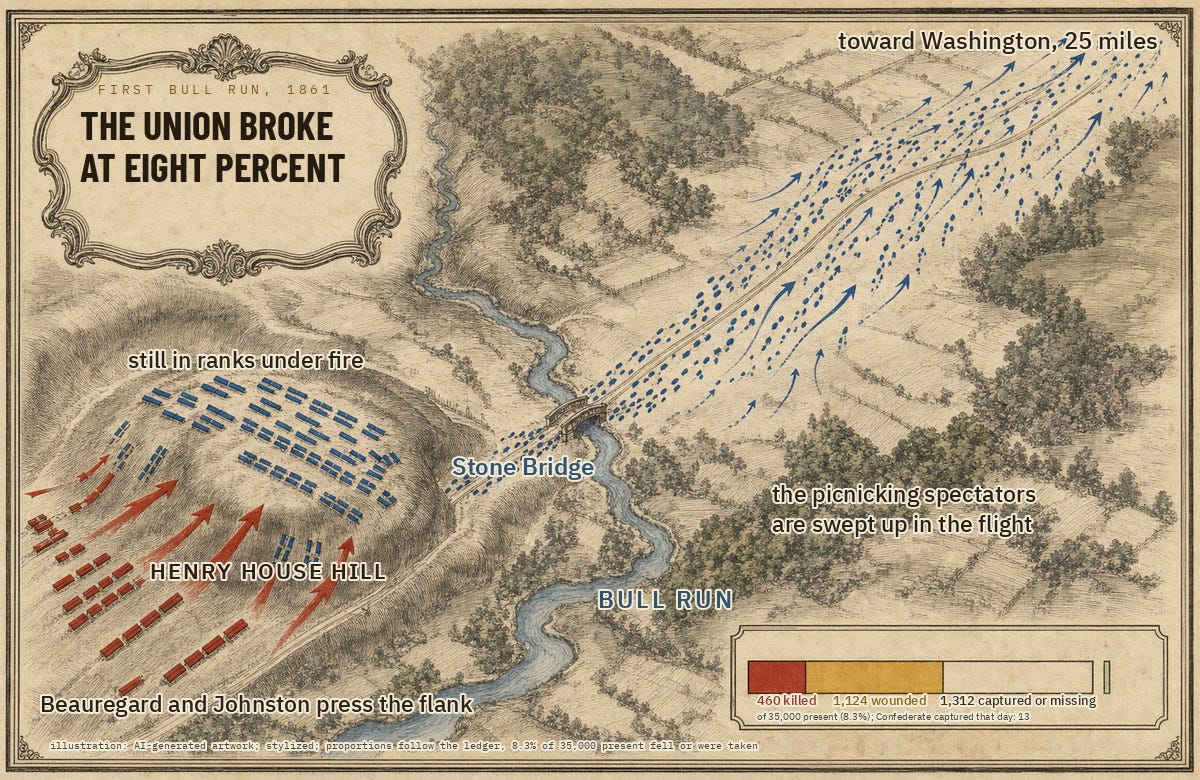
How to read it: blue formations hold the hill, red arrows press, and the rout tapers off toward Washington; the inset bar splits the day’s casualties into killed, wounded, and captured or missing.
What to see: both sides bled at similar rates while they fought, then one side stopped, and 1,312-against-13 in prisoners is what a broken will looks like in a ledger.
2. Breaking early is the rule, and casualties are a lousy predictor of when. The foundational study is Dorothy Clark’s 1954 Operations Research Office report, which examined 43 battalion engagements in which units broke. She found casualties were probably not the primary cause of breaking, and in about a third of her cases the battalion had already absorbed over 40% casualties before it quit. Helmbold’s 1971 RAND review put historical breakpoints anywhere from roughly 10% to 70% of strength, with leadership, support, and communication mattering more than attrition. Two things follow. First, units break well short of annihilation, essentially always. Second, there is no magic number. My simulations sweep breakpoints across 8–40%, spanning the lower-middle of that observed 10–70% range; the sweep dips below the literature’s floor because Bull Run’s observed 8.3% break anchors the low end. That band is my modeling assumption, not a literature finding, and I will keep saying so. Clausewitz put the underlying idea in one sentence: an enemy’s power of resistance is “the product of two inseparable factors, viz. the total means at his disposal and the strength of his will.” The means are countable. The will is the part that fails first.
3. You can put the breaking point in the math, and the math checks out. The engine is Lanchester’s square law, the 1916 aimed-fire attrition model that operations researchers have used for a century, plus one addition: each unit routs when its casualty fraction crosses a threshold, and that threshold varies run to run. Validation is the part I care about. In 1954 J. H. Engel fit the square law to daily American casualty data from Iwo Jima and published attrition coefficients. My independent refit of the same daily series recovers A = 0.0565 against Engel’s published 0.0544. The R-squared is 0.992 on 35 daily points, but read that number gently: the fit is to the daily strength series, a cumulative and monotone curve that flatters R-squared by construction. The meaningful check is the coefficient landing within 4% of Engel’s. And the spine has survived a hostile audit before: Robert W. Samz’s 1972 Operations Research technical note revised Engel’s Iwo Jima data and found the revised data still fit. A small credibility bonus from doing the homework: a different value for Engel’s coefficient circulates in secondary sources, and it turns out to be a transcription error that has been copied around for decades. I pulled the 1954 paper scan and read the number off the page. The model also reproduces Bull Run’s rout at 8.3%, Pickett’s roughly 19% Union casualties, and Trafalgar’s zero British ships lost, before any counterfactual is run.
4. Iwo Jima already ran this natural experiment on unbreakable wills. The one force in the dataset with a genuinely unbreakable will was not an AI. It was the Japanese garrison of Iwo Jima, February 19 to March 26, 1945. Kuribayashi ordered each man to treat his position as his grave and to kill ten of the enemy before dying, forbade the banzai charges that had squandered earlier garrisons, and fought a defense in depth designed to maximize American casualties rather than to win. Of a garrison of roughly 21,000, only 216 were taken prisoner during the battle. That is a breakpoint of one: fight until dead. The model puts a price on it. Give Japan a normal human breakpoint and simulated US casualties fall from 21,431 to 10,969, a ratio of 1.95x, and the battle shortens from 36.4 days to 10.7, a ratio of 3.4x (n = 15,000 runs per condition; the Monte Carlo means are stable to a couple of men). Those are model outputs on Engel’s assault-echelon accounting basis, where the historical figure is 20,860 over 36 days; the roughly 26,000 casualties you may have read elsewhere is the all-services total for the whole operation, a different basis, and the two must not be mixed. The sentence I want a planner to carry out of this post: a real unbreakable will already existed once, and it doubled American casualties. It did not change who won.
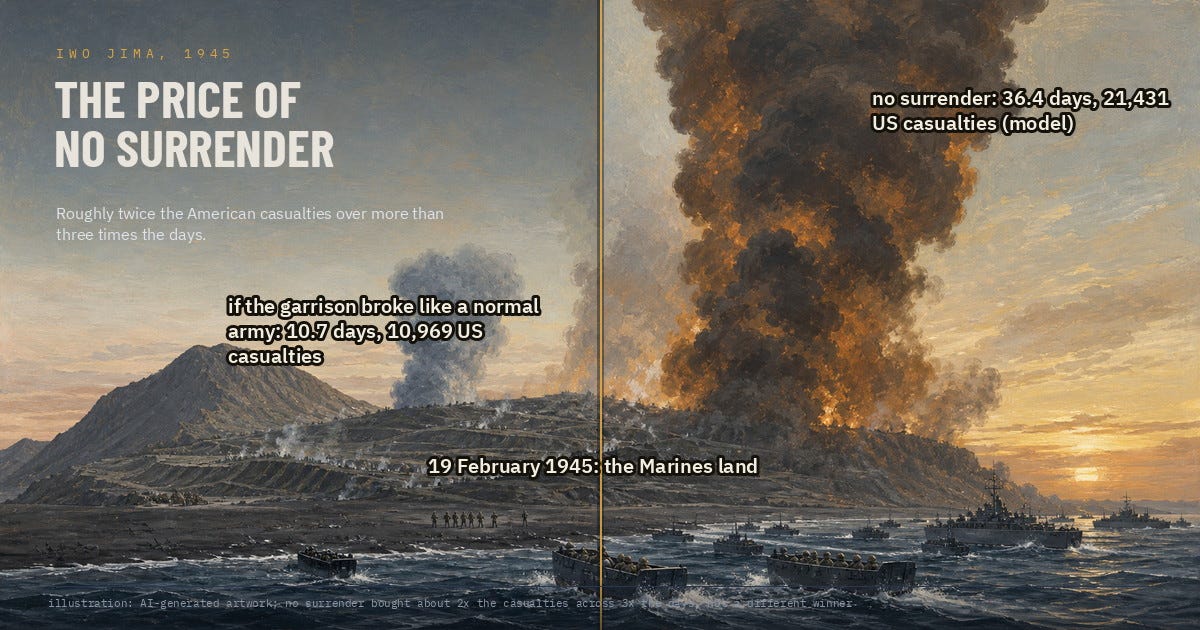
How to read it: the cool low column at the left is the counterfactual, the towering brass-lit column the real battle, Suribachi and the landing craft between them.
What to see: the will did not move the outcome, only how long and how bloody it was. Roughly 2x the casualties across 3x the days.
5. At Pickett’s Charge, the breakpoint was the whole battle. On July 3, 1863, 11,481 Confederate infantry crossed nearly three-quarters of a mile of open ground against the Union center and were repulsed in about an hour, losing roughly half their number. In the model the charge succeeds 4.2% of the time (95% CI 3.9–4.6%, Monte Carlo); the validation ensemble puts it at 4.9%, and the 2022 continuous-flow simulation study of the charge by Poggie, Matei, and Kirchubel puts it near 6%. Attribute each number to its method and they agree: a long shot. Now move the will around. If the Union artillery had been weak-willed and fled at 10% losses, the model makes the charge a coin flip: 49.1% Confederate win (95% CI 48.3–49.9%). The historical guns did not flee. At the wall called The Angle, Lieutenant Alonzo Cushing, twice wounded, refused evacuation and kept his last guns firing until he was killed; he received the Medal of Honor for it 151 years later, in 2014 and if you’re building an AI enabled strategic weapon you should name it after him. The model says that steadfastness was worth about 45 points of win probability. And if the entire Confederate assault cannot break, it takes the ridge in 92.0% of runs (95% CI 91.6–92.5%) and never loses; the remaining 8% are stalemates at nightfall, not Union wins.
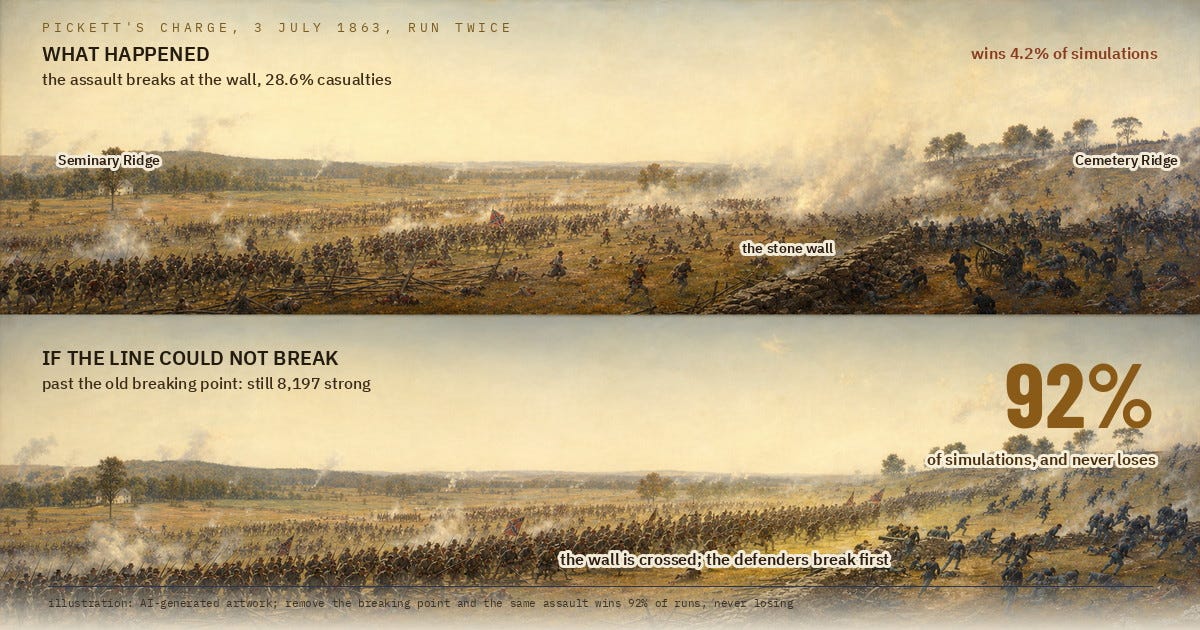
How to read it: the same field painted twice; above is what happened, below is the assault if the line could not break.
What to see: the same men with the breaking point removed cross the wall and win 92% of runs. Proportions follow the measured 92% win rate.
Between those poles sits a threshold. Sweep the AI unbreakable-will share of the assault upward and the winner flips at just over three-fifths, 62% on a deterministic 1% scan, with the Monte Carlo curve crossing even odds at the same spot. Below that share, the extra AI-resolve buys deeper casualties and the same defeat.
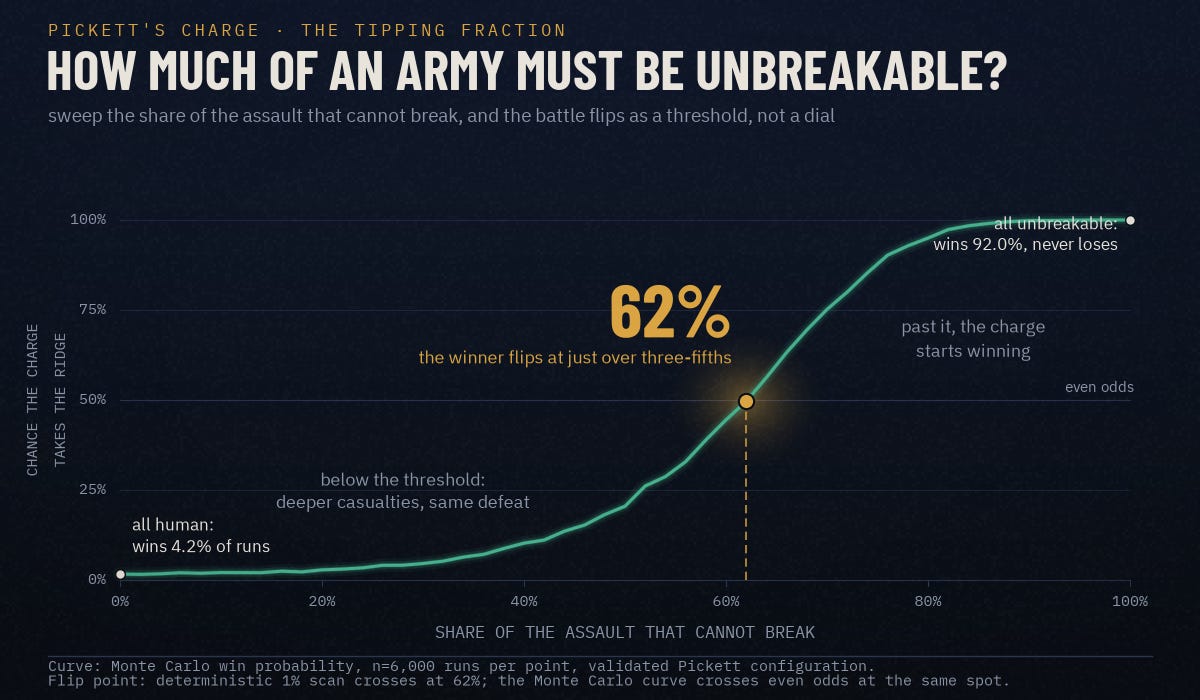
How to read it: Sweep the share of the assault that cannot break from none to all; the curve is the simulated chance the Confederates take the ridge, and the brass point is where the model’s winner flips.
What to see: Unbreakable AI-will is a threshold, not a dial; below just over three-fifths (62%) the added resolve only deepens the casualty bill.
6. An unbreakable AI-will is not a cheat code. Run the same experiment on the other battles and the flip disappears. Make 40% of the Union force at Bull Run unbreakable and the rout becomes a stalemate; the human 60% still breaks on schedule, the AI contingent holds the hill into the night, and no fraction up to 100% converts holding into winning at the army’s measured effectiveness. Make the whole force unbreakable and more than 99.9% of 15,000 runs still end in stalemate; no run produced a Union victory, so the residual is a statistical bound, not an observed event. At Trafalgar, even a Combined French-Spanish fleet that never strikes its colors loses 83.6% of the time (95% CI 83.0–84.2%), because Nelson’s gunnery and concentration decide the fight before any morale check matters. Why will is usually a tiebreaker rather than a war-winner is the next post but one; for now, the pattern is enough. Removing the breaking point reliably changes the body count. It changes the winner only when the fight was close on capability to begin with.
7. Men are surrendering to machines right now. In August 2024 a Ukrainian brigade used a drone to walk a wounded, abandoned Russian soldier through a surrender: it dropped water and written instructions, then guided him to Ukrainian lines. By March 2026, Ukraine’s digital-transformation minister Mykhailo Fedorov claimed drone units had compelled more than 100 Russian soldiers to surrender over the winter alone; that is a belligerent’s own count, so read it as an order of magnitude, not a ledger entry. But the mechanism is the one in this post. A man does not surrender to a drone because he ran out of bullets. He surrenders because his will broke against something that does not have one.
Best Arguments Against This
The strongest objection goes at the model’s heart: I trigger routs on casualty fractions, and the foundational literature says casualty fractions are a poor predictor of breaking. Clark found leadership, support, and communication mattered more; a third of her broken battalions had already passed 40% losses before quitting. So the model uses, as its trigger, the very variable the best empirical study demoted. I partly concede this. The defense is threefold. The threshold in each baseline is calibrated to the level at which the historical unit actually broke, so it is a summary of whatever really caused the break, not a theory of it. The thresholds vary randomly across Monte Carlo runs, encoding Clark’s finding that breakpoints scatter widely. And the counterfactual question, what changes when the break is removed entirely, does not depend on what triggers the break, only that one existed and the record shows roughly where it fired.
Three smaller objections deserve print. The model is temporal, not spatial: no terrain, no flanking, no reserve decisions, so a battle it flips might not flip on real ground; an agent-based recheck is the single most likely thing to damage these results. The calibration inherits a bias: coefficients fit to total casualties, including losses taken during the rout and pursuit, understate the loser’s fighting capability. I hedge that with effectiveness sweeps here, and a later post returns to it with corrected data. And the campaign-level empirical record for Lanchester models is contested: Bracken (1995) found the linear law fit the Ardennes campaign, Fricker (1998) refit it and found neither law fit, and Lucas and Turkes (2004) found no basic law fits Kursk or the Ardennes well. That record is exactly why this series calibrates each battle separately and prints orderings with bands, not point forecasts.
What Would Change My Mind
First, a spatial or agent-based re-implementation, with terrain, suppression, and local maneuver, that reverses the Pickett flip or the Iwo Jima cost doubling.
Second, evidence from Ukraine through 2027 of human units routinely fighting to near annihilation without machine substitution, meaning breakpoints near 100% at scale. That would say human will is far more elastic than the 10–70% historical band, and the whole breakpoint frame is miscalibrated.
The method, briefly
A battle is not a subtraction problem. It is a race between two breaking points, and the side that reaches its own threshold first loses everything it has not yet lost. Hold that model, but hold it loosely: next post, an audit of 607 usable defeats from a roughly 660-battle database asks how often morale actually was the thing that broke, and the answer embarrassed me.