AI Great Powers Part 7 Empty Halls: China Builds AI Data Centers 15–30× Faster Than It Can Fill Them

Here in Northern Virginia we have a battle over data centers. The companies can’t build them fast enough, the local governments are desperate for their tax revenue to balance their (school) budgets, and the people don’t want them anywhere near their back yard. In China, the local governments subsidize the data centers but the country can’t build enough compute to fill them. From orbit, the Horinger campus is eight data halls standing in a field of forty-two graded pads that aren’t even worth building because they would sit empty.
Results Up Front
This is long, and I do not expect most people to read the whole thing. Here is what a decision-maker should take away.
China’s AI data-center problem is not buildings, power, or cooling. Halls go up roughly 15–30× faster than chips arrive to fill them, and the other inputs run similarly ahead of what the silicon needs: cooling supply ~15–30×, western-hub power ~15–20×. The fleet is real and vast (about 27.1 GW of IT power in use as of mid-2025), and the official AI-compute statistic, 1,590 EFLOPS-FP16 at end-2025, is real installed silicon. But that stock was assembled from one-time pools (stockpiled foreign memory, banned NVIDIA imports, a shrinking gray market) that do not repeat. The repeatable, domestically sustainable flow is about 200–310 EFLOPS-FP16 per year, against a build-out ambition running ~400+ per year. By 2028, sustainable chip supply covers ~47% (low) / ~69% (base) / ~102% (high) of the stated ambition. And the high case requires two things Beijing itself has so far blocked or that have already slipped.
So the forecast, stated plainly and dated so you can grade me on it: expect rising stranded and underfilled AI data-center shells in China’s western hubs over the next 6–12 months. Halls and substations finished; racks waiting on chips. The specific things to watch, and what would prove me wrong, are at the end.
One housekeeping note before the numbers. Every claim here is time-boxed: imagery claims are stamped to the collection date of the frame; document claims to the filing date; “as of June 2026” is the series freshness stamp. A built shell is not an operating data center. Where I project, I label the projection and its confidence. Fleet figures are mid-2025 (the official census point); compute figures are end-2025 (Ministry of Industry and Information Technology aka MIIT’s reporting point); each satellite plate carries its own date band.
The buildings are real, and enormous
Start with what China has actually built, because none of this argument works if the fleet is vapor. It is not.
As of mid-2025, China’s in-use data-center fleet runs about 27.1 GW of IT power, roughly 40 GW of total facility power, built from 10.85 million standard racks (a 标准机架 is a 2.5 kW-equivalent accounting unit; the rack count converts to IT megawatts exactly, at 400 racks per MW). Utilization (上架率, the share of racks actually filled) sits around 63%. The fleet averages a PUE of 1.47 (Power Usage Effectiveness, total facility power divided by IT power, so 1.47 means 47 cents of overhead on every dollar of compute power) and consumes about 2% of China’s national electricity, roughly 170 TWh (1,700亿 kWh) a year.
Those are filings-grade numbers, not estimates. The rack census is the official MIIT (Ministry of Industry and Information Technology) count; the power figure cross-checks against the national energy statistics independently. Phantom racks don’t draw real terawatt-hours. (DC ledger, claim 1: High confidence.)
Who owns it matters for everything downstream: the three state telcos hold ~50%, third-party colocation providers ~25%, hyperscaler self-build ~25%. The state-controlled bloc is both the largest and the fastest-growing. China’s data-center build-out is, to a first approximation, a state program executed by state-owned operators on state-owned land with state-engineered power. The draw that pulls it west was always the electricity price. Part 5 follows that money.

*How to read it: six panels. Fleet capacity growth (IT vs total-facility GW, 2022→mid-2025); the flow gap (repeatable EFLOPS additions vs nameplate-growth demand); the min() slack bars (cooling and power dwarf the chips bar); IT-MW by hub (west red, east blue); supplier revenues; and the 2028 chip-backed 47/69/102% scenarios. All time-boxed mid/end-2025. What to see: the buildings-and-power panels are big and healthy; the chips bar in the min() panel is the one under strain. *
The filling problem: anatomy of an inflated EFLOPS number
Now the silicon. China’s official “intelligent computing power” (智能算力) statistic was 1,590 EFLOPS at end-2025: that is exaFLOPS at FP16, the half-precision arithmetic AI training uses, on the dense (not sparse) counting convention. Mid-2025 the same official series read 788. On its face: a doubling in six months.
The number is not fake. It is inflated, and the inflation has a specific, technical anatomy worth walking through, because it is the kind of thing that gets briefed upward as a single scary integer.
Three measurements of the same country, taken at end-2025:
The official census: 1,590 EFLOPS. This is a 对外可用 (”available to external users”) aggregated metric. The same silicon gets counted at the owner layer AND at the aggregator layer: a telco builds a cluster, counts it, then a compute-aggregation platform lists the same cluster as “accessed capacity” and counts it again. China Mobile’s own annual report shows the mechanism: 92.5 EFLOPS “total,” of which only 33.3 is self-built and ~59 is rented in, with a footnote warning you not to sum them. The national statistic sums them.
The owned-silicon estimate: ~1,200–1,400 EFLOPS. Strip the owner/aggregator double-count and this is what the same evidence supports: a 15–25% haircut. Independent trackers land below the official line too (IDC at 1,037; CCID under 1,200), which corroborates the inflation reading. (DC ledger, claim 2: Med-High.)
The named clusters: ~630 EFLOPS. Sum the 42 officially named 万卡-class (10,000-card-class) clusters (MIIT’s count of built 万卡级 clusters, each running roughly ten to twenty thousand accelerators) and you get roughly 630, about 40% of the headline.
Read those three numbers as an evidence-grade ladder, because that sorting is itself the finding: the named-cluster floor is what you can point at; the owned-silicon band is what the filings support; the official census is what gets quoted. The gap between the first and the last is ~2.5×.
One more precision trap, briefly, for the engineers: China also publishes a 总算力 (”total computing power”) figure of 280 EFLOPS. That one is FP32-blended and must never be summed or compared with the FP16 智能算力 series. Different arithmetic, different universe. Keeping the precisions separate was, embarrassingly often, the hardest part of this project.
Accounting perimeter matters. I know that is not the kind of sentence that lights up a room. It is the sentence that keeps you from being fooled by a 2.5× spread on the same country’s compute.
Stock versus flow: the argument that survives
Here is the part that matters more than the inflation, because it holds even if you grant Beijing the full 1,590.
The installed stock is real. The question is whether it repeats. And the 2025 stock was assembled from one-time, non-repeating pools: a stockpile of imported foreign HBM (high-bandwidth memory, the stacked DRAM every serious AI accelerator must be packaged with, and China’s single binding shortage), plus over a million NVIDIA H20s before that channel closed in April 2025, plus a gray market now shrinking. The stockpile arithmetic and exhaustion dates are Part 6’s story, told there in full; the one-sentence version is that the imported memory ran out around end-2025 and the pre-ban die-bank early 2026.
What remains when the one-time pools are gone is the flow: the repeatable, domestically sustainable rate at which China can add AI compute. That rate is about 200–310 EFLOPS-FP16 per year.
Be precise about where that band comes from, because this is the one place the two projects in this series touch. These are not two independent estimates of the same number. This demand-side study consumed the supply-side ceiling, the fab project’s HBM-bound ~225k Ascend-910C-equivalents per year for 2026 (P10–P90: 192–270k; Part 6 derives it), and re-expressed it at the data-center layer. What this project adds is that nothing it could observe independently contradicts that ceiling: power contracts, hall counts, utilization disclosures, supplier financials. All came back consistent with it. And when I reconciled the whole picture against nine external trackers (Synergy, CDCC, 科智, TrendForce, Epoch AI, SemiAnalysis, IDC, CCID, 前瞻) the result was zero conflicts; every divergence was definitional tension, not contradiction, and SemiAnalysis, Epoch, and TrendForce independently corroborate the HBM-bound accelerator rate itself. That is corroboration of the ceiling, not a re-derivation of it. (DC ledger, claim 4: High; it survived the red team precisely as this flow claim.)
Against that 200–310/yr flow, the nameplate growth ambition runs ~400+ EFLOPS per year. Project both lines forward and the chip-backed share of the ambition falls from ~83% in 2025 to three 2028 scenarios:
Low (HBM-locked): ~47% chip-backed share of ambition; requires only the current trajectory.
Base (CXMT ramps): ~69%; requires domestic HBM mass production arriving on schedule.
High: ~102%; requires CXMT HBM3 mass production and NVIDIA re-access at scale.
The gap closes only in High, and both of High’s legs are wobbling. CXMT’s HBM3 mass production has slipped to 2H-2026/2027 with reported yields below 50% (Part 6 covers why that slip is structural). And when Washington opened an H200 license window in January 2026, Beijing blocked it: zero delivered, firms told to buy Ascend. The chip gap is now partly a policy choice on China’s own side, which is one of the stranger findings in this project. They need those H200s. It calls into question if the broader Chinese industry and government is speaking truth to power so they can make informed policy choices.
How to read it: the left panel is annual compute ADDED. The one-time pools (stockpiled memory, banned imports) that carried 2025’s additions collapse, and in every later year the repeatable domestic additions run below the additions the nameplate ambition requires; the right panel reconciles the 2025 LEVEL estimates (the official census, the owned-silicon band, the bottom-up bounds). What to see: the cumulative gap widens year over year; only the chip path moves between scenarios.

How to read it: the three terms of min(power, accelerators, cooling) on a common FP16 basis, 2025. What to see: liquid cooling runs ~15–30× ahead of what the chips need, power ~15–20× in the western hubs; accelerators are the min() by more than an order of magnitude. (DC ledger, claim 5: High.)

This is the mirror image of Part 6. There, the finding was that China’s chip output reduces to its memory supply. Here, the finding is that everything around the chips (concrete, megawatts, coolant) is abundant. Where the two projects genuinely meet is in the physical record: halls going up 15–30× faster than chips arrive to fill them. The fab study explains why the chips can’t come faster. The data-center study shows the buildings waiting for them.
Ground truth from orbit
Models are arguments. Buildings are facts. So I pulled the imagery.
Horinger (和林格尔), Inner Mongolia
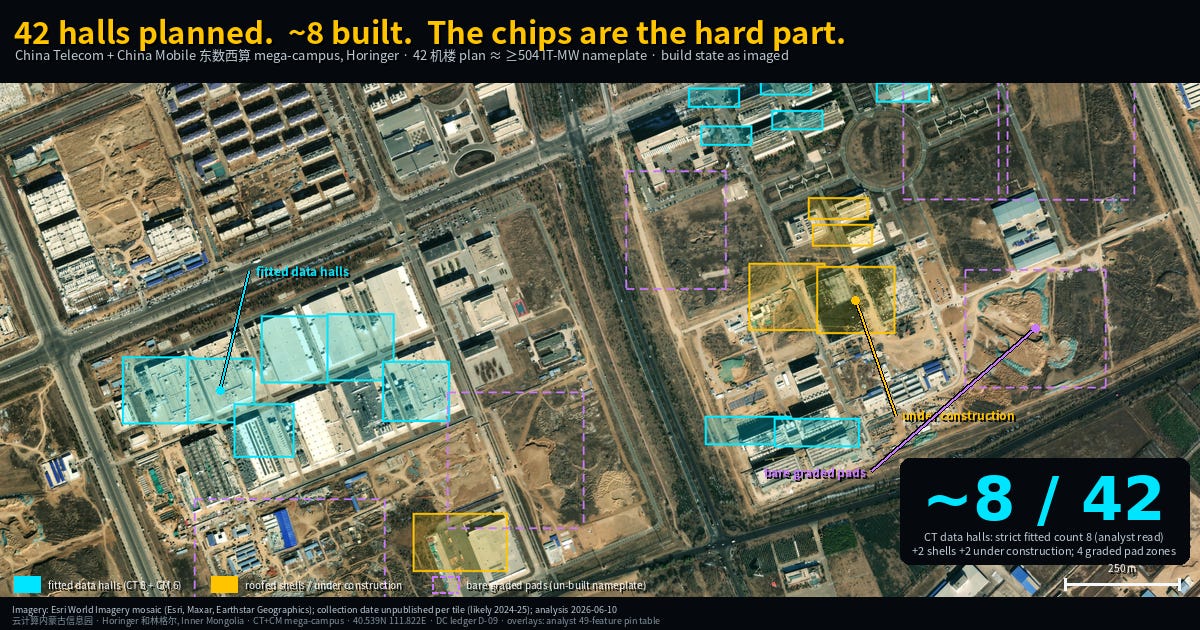
Horinger (和林格尔), Inner Mongolia: the China Telecom + China Mobile mega-campus, on a dated 0.35 m commercial frame. How to read it: cyan = externally complete data halls (8 on the CT side, 6 on the CM side), amber = roofed shells and halls under construction, violet = bare graded pads, and the new south power-yard (the likely 220 kV substation, under construction). What to see: a strict count of 8 of the planned 42 机楼 (data halls) externally complete; the violet majority is the un-built nameplate. Every pin placed from an independent imagery-analyst feature inventory on the 2026-04-20 frame. Imagery © SkyFi (LG05), collected 2026-04-20, 0.35 m.

This is the hero exhibit, and it deserves a slow look. The Horinger information park is one of the flagship campuses of 东数西算 (”East Data, West Compute”), the national program moving AI compute to the cheap-power west. Its disclosed plan is 42 data halls: a nameplate of at least 504 IT-MW. What the imagery shows, as of the capture: about eight halls externally complete, two roofed shells, two halls under active construction, and a vast field of graded pads where the rest of the plan would go. Counting that campus’s full-build nameplate as operating capacity over-counts by roughly 5× on the strict count (about 3.5× even counting shells and open frames generously). And across the flagship western campuses the imaged pattern repeats: operating capacity runs ~20–40% of disclosed nameplate (Wuhu’s Huawei campus: ~20% built as imaged; its headline 1.13 GW is an environmental-filing terminal figure, not steel).
The pads are not a scandal. They are a schedule. The schedule is the problem: the concrete is on time, and the silicon is not coming.
Huawei Cloud Gui’an (贵安), Guizhou
Gui’an is where the chips-bind-power-doesn’t argument gets a single-campus stress test, from documents rather than pixels (because I’ve spent too much on overhead imagery as it is). Per state media (新华网), the campus had deployed more than 110,000 Ascend accelerators by October 2025. Run the card-level power arithmetic (0.3–0.4 kW per accelerator card, the most-likely band) and the implied facility draw of that card fleet (the cards plus their host-node share, at liquid-cooled PUE ~1.1) is about 50–75 MW. Now look at what the environmental filings disclose on the power side: a dedicated 220 kV substation building from 300 MVA near-term to 800 MVA terminal (MVA, mega-volt-amperes, is apparent power; derate by a 0.9 power factor for usable MW). The near-term block alone covers the entire deployed card load 4–5 times over.
Label the bases before anyone divides the wrong numbers: that 50–75 MW is the card-level basis, the deployed card fleet and its immediate hosting overhead. Dimension the campus instead at the full-system level (~4.5–6 kW per card once you count host servers, interconnect, storage, and the cooling share) and 110,000 cards imply roughly 495–660 MW, which is what the 800 MVA terminal build is plainly sized for. Same campus, two honest numbers, one conclusion: the substations are engineered years ahead of the silicon, on both bases. Power is the slack variable. Chips are the binding one. (DC3 memo, memo_guizhou.md: High on the disclosures, inferred on per-card draw; direction robust.)
Zhongwei (宁夏中卫), the Western Cloud Base
Zhongwei (宁夏中卫), the Western Cloud Base. How to read it: cyan = the central white hall array (about 12 roof modules, the lower pair more fitted-out), amber = power/genset and cooling support, yellow = on-site solar, violet = bare graded expansion pads; small markers = power yards (voltage not determinable from overhead). Honesty baked in: this is a MULTI-TENANT belt, so the array is a 中金 Zhongjin candidate by scale and position, not a confirmed operator count, and the disclosed 2×330 kV / 2,880 MVA yard is a document figure, not isolable in this frame. Every pin from an independent imagery-analyst inventory. Imagery © Esri World Imagery (mosaic; capture date unpublished, likely 2024-25); bare desert in Sentinel-2 2020 → dense park by 2024 (© EOX/Copernicus); analyst pin pass 2026-06-11.

Zhongwei completes the pattern at hub scale. The cluster discloses 2.77 GW of facility power targeting 800 EFLOPS by 2027. Set that single hub’s target against the national repeatable chip flow of ~200–310 EFLOPS per year and the mismatch stops being subtle: filling one desert hub’s target would consume roughly two and a half to four years of the entire country’s sustainable accelerator output. Either Zhongwei gets the chips and everywhere else doesn’t, or the halls wait. The desert transformed from bare sand in 2020 to a dense park by 2024. The build side performs. The fill side cannot.
The forecast: dated, falsifiable, and I will grade myself
Analysts get to be vague. Forecasts don’t. Here is mine, stamped June 2026, with the checkpoints that would prove it wrong.
The prediction: over the next 6–12 months (through roughly mid-2027), China’s western AI hubs will show rising stranded or underfilled shells: finished halls and energized substations materially ahead of installed, operating silicon. Specifically:
Horinger: the built-hall count rises only modestly off the analyst-pinned baseline (8 externally complete on the CT side, 6 on CM), while the graded-pad majority persists; construction does not pause (the building machine is policy-driven and scenario-insensitive), so the built-but-unfilled gap widens. Verifiable by re-imaging the same frame.
Gui’an: disclosed power capacity (the 300→800 MVA build-out plus the AZ3 filing) continues to grow faster than disclosed deployed accelerators; the card-implied power draw stays a small fraction of energized capacity. Verifiable from EIA filings + operator disclosures against the card counts state media publishes.
Utilization: 上架率 disclosures for the new western AI campuses come in materially below the ~63% national fleet average. And note the policy tripwire here: in the quota-bound eastern metros, Shanghai’s 14th Five-Year-Plan energy rules imposed a two-year claw-back clock. A project must reach production within two years or lose its energy-quota support (document-dated to that plan period, 2021–25, which has now ended; carry-over into the current plan not yet verified; DC3). If shells strand at scale, expect that claw-back logic to be renewed and to migrate west. Idle halls losing their power allocations is what the endgame of this prediction looks like in policy documents, and whether the clock reappears in current-plan energy rules by mid-2027 is itself checkable.
What would falsify it (any one of these, and you should discount this article): CXMT reaching genuine HBM3 mass production at healthy yield in 2026; Beijing reversing course and admitting NVIDIA at scale; western-hub utilization disclosures converging on the national average while construction continues; or re-imaging showing Horinger’s pads filling with fitted, cooled, energized halls at a pace the chip flow could plausibly populate.
First grade, dated 2026-04-20. I did re-image Horinger. A 0.35 m commercial frame (SkyFi LG05, collected 2026-04-20), graded pin-by-pin by an independent imagery analyst against the baseline, holds the forecast with nuance. The strict fitted-hall count is unchanged: still 8 on the CT side, 6 on CM, and the large CT eastern reserve is still open or graded. And construction did not pause: two CT footprints advanced from open frames to roofed shells, a new CT pad broke ground, and on the CM side two new halls plus a power-yard (the likely 220 kV substation the tender described) are under construction. That last detail is the whole thesis in one frame: the substation, the power, arriving ahead of the halls, which arrive ahead of the chips. The full six-to-twelve-month trend grade completes by mid-2027; this dated baseline is the first checkpoint, and it points the way the forecast called. One confession, because the method is the product: my own first glance at the raw frame guessed the campus had filled faster than this.
The halls are not evidence of strength, and they are not evidence of fraud. They are a bet, placed with concrete, at state scale, on a chip supply that Part 6 shows cannot arrive on the schedule the concrete assumes.
It is a fleet of buildings waiting for a fleet of chips.
Only one of those fleets is on schedule.
Receipts
Fleet ≈ 27.1 GW IT / ~40 GW facility, mid-2025; ~63% utilized: High; MIIT rack census, power-corroborated against national electricity data.
Official 1,590 EFLOPS-FP16 (end-2025) is ~15–25% aggregation-inflated; owned-silicon ≈ 1,200–1,400; named clusters ≈ 630: Med-High; operator annual-report mechanism + IDC/CCID running below the official line.
Accelerators bind; repeatable flow ≈ 200–310 EFLOPS-FP16/yr vs ~400+/yr ambition; 2028 chip-backed 47/69/102%: High as a flow claim; this survived a four-lens adversarial panel (precision-artifact, double-count, chip-backed-too-low, external reconciliation) precisely in this form. The fragile snapshot version was demoted, which is itself part of the method.
Power/cooling slack ~15–20×/~15–30×; Gui’an card-basis ~50–75 MW vs 300→800 MVA disclosed: High on disclosures, inferred per-card draw, direction robust.
Horinger 8/42 halls on the strict fitted count (+2 shells +2 under construction; analyst-pinned 49-feature inventory, 2026-06-10); flagship western campuses operating ~20–40% of nameplate: imagery-graded, stamped per plate.
Time-boxing: fleet figures mid-2025; compute figures end-2025; imagery as stamped on each plate (Esri mosaics carry no published capture date; stated honestly, bounded by Sentinel-2 change-pairs); forecast issued June 2026, graded by mid-2027.
The supply-side ceiling this article consumes is derived, Monte-Carlo’d, and receipted in Part 6. Part 5 follows the money that builds these halls. Part 8 carries the flow framing forward to the decade clock. Imagery © Esri World Imagery and © EOX/Copernicus Sentinel-2, as credited per frame.